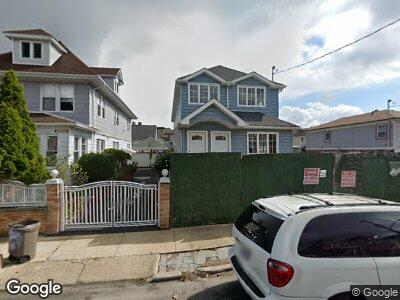
111-25 116th St South Ozone Park, NY 11420
South Ozone Park NeighborhoodEstimated Value: $1,111,549 - $1,221,000
6
Beds
2
Baths
2,180
Sq Ft
$529/Sq Ft
Est. Value
About This Home
This home is located at 111-25 116th St, South Ozone Park, NY 11420 and is currently estimated at $1,152,137, approximately $528 per square foot. 111-25 116th St is a home located in Queens County with nearby schools including P.S. 100 - Glen Morris, J.H.S. 226 Virgil I. Grisson, and John Adams High School.
Ownership History
Date
Name
Owned For
Owner Type
Purchase Details
Closed on
Sep 24, 2024
Sold by
111-25 116 Llc
Bought by
104 Oxford Realty Llc
Current Estimated Value
Purchase Details
Closed on
Oct 8, 2015
Sold by
Bridglall Mahadai
Bought by
111-25 116 Llc
Purchase Details
Closed on
Jan 7, 2011
Sold by
Singh Dindyal
Bought by
Bridglall Mahadai
Purchase Details
Closed on
Apr 30, 2007
Sold by
Dass Paltoo
Bought by
Singh Dindyal
Purchase Details
Closed on
Nov 13, 2006
Sold by
Oasman Moheed
Bought by
Dass Paltoo
Purchase Details
Closed on
May 13, 2004
Sold by
Zea Ruben
Bought by
Oasman Moheed
Home Financials for this Owner
Home Financials are based on the most recent Mortgage that was taken out on this home.
Original Mortgage
$335,600
Interest Rate
5.88%
Mortgage Type
Purchase Money Mortgage
Create a Home Valuation Report for This Property
The Home Valuation Report is an in-depth analysis detailing your home's value as well as a comparison with similar homes in the area
Home Values in the Area
Average Home Value in this Area
Purchase History
| Date | Buyer | Sale Price | Title Company |
|---|---|---|---|
| 104 Oxford Realty Llc | $1,100,000 | -- | |
| 111-25 116 Llc | $24,000 | -- | |
| 111 & 25 116 Llc | $24,000 | -- | |
| Bridglall Mahadai | $320,000 | -- | |
| Bridglall Mahadai | $320,000 | -- | |
| Singh Dindyal | -- | -- | |
| Singh Dindyal | -- | -- | |
| Dass Paltoo | $700,000 | -- | |
| Dass Paltoo | $700,000 | -- | |
| Oasman Moheed | $420,000 | -- | |
| Oasman Moheed | $420,000 | -- |
Source: Public Records
Mortgage History
| Date | Status | Borrower | Loan Amount |
|---|---|---|---|
| Previous Owner | 111 & 25 Llc | $410,000 | |
| Previous Owner | Oasman Moheed | $335,600 | |
| Previous Owner | Zea Ruben | $141,000 |
Source: Public Records
Tax History Compared to Growth
Tax History
| Year | Tax Paid | Tax Assessment Tax Assessment Total Assessment is a certain percentage of the fair market value that is determined by local assessors to be the total taxable value of land and additions on the property. | Land | Improvement |
|---|---|---|---|---|
| 2024 | $7,930 | $39,482 | $18,782 | $20,700 |
| 2023 | $7,761 | $38,640 | $18,382 | $20,258 |
| 2022 | $7,714 | $60,540 | $28,680 | $31,860 |
| 2021 | $8,132 | $55,500 | $28,680 | $26,820 |
| 2020 | $7,990 | $53,880 | $28,680 | $25,200 |
| 2019 | $2,594 | $29,280 | $28,680 | $600 |
| 2018 | $2,385 | $11,700 | $11,100 | $600 |
| 2017 | $4,003 | $26,012 | $10,282 | $15,730 |
| 2016 | $4,906 | $26,012 | $10,282 | $15,730 |
| 2015 | $3,775 | $23,760 | $11,100 | $12,660 |
| 2014 | $3,775 | $23,280 | $11,100 | $12,180 |
Source: Public Records
Map
Nearby Homes
- 111-24 116th St
- 116-18 111th Ave
- 11115 117th St
- 115-17 Linden Blvd
- 11505 Linden Blvd
- 10945 116th St
- 11421 Linden Blvd
- 114-01 115th St
- 10929 116th St
- 11140 114th St
- 111-40 114th St
- 109-33 118th St
- 114-15 118th St
- 10916 118th St
- 11911 Linden Blvd
- 109-14 115th St
- 117-10 109th Ave
- 109-18 Lefferts Blvd Unit A3
- 114-08 Rockaway Blvd
- 115-03 115th St