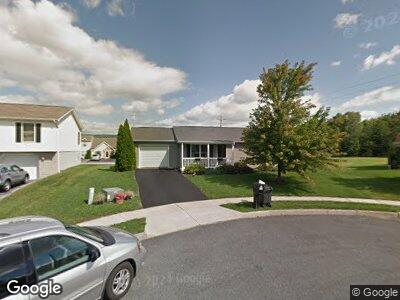
111 Austin Dr Enola, PA 17025
East Pennsboro NeighborhoodEstimated Value: $239,688 - $286,000
2
Beds
2
Baths
1,092
Sq Ft
$241/Sq Ft
Est. Value
About This Home
This home is located at 111 Austin Dr, Enola, PA 17025 and is currently estimated at $263,172, approximately $241 per square foot. 111 Austin Dr is a home located in Cumberland County with nearby schools including East Pennsboro Area Middle School, East Pennsboro Area Senior High School, and Harrisburg Academy.
Ownership History
Date
Name
Owned For
Owner Type
Purchase Details
Closed on
Mar 30, 2007
Sold by
Sheaffer Cindy E
Bought by
Paladino Frank A
Current Estimated Value
Home Financials for this Owner
Home Financials are based on the most recent Mortgage that was taken out on this home.
Original Mortgage
$161,500
Interest Rate
6.24%
Mortgage Type
New Conventional
Create a Home Valuation Report for This Property
The Home Valuation Report is an in-depth analysis detailing your home's value as well as a comparison with similar homes in the area
Home Values in the Area
Average Home Value in this Area
Purchase History
| Date | Buyer | Sale Price | Title Company |
|---|---|---|---|
| Paladino Frank A | $17,000 | -- |
Source: Public Records
Mortgage History
| Date | Status | Borrower | Loan Amount |
|---|---|---|---|
| Open | Paladino Frank A | $141,600 | |
| Closed | Paladino Frank A | $161,500 |
Source: Public Records
Tax History Compared to Growth
Tax History
| Year | Tax Paid | Tax Assessment Tax Assessment Total Assessment is a certain percentage of the fair market value that is determined by local assessors to be the total taxable value of land and additions on the property. | Land | Improvement |
|---|---|---|---|---|
| 2025 | $3,557 | $172,300 | $50,600 | $121,700 |
| 2024 | $3,355 | $172,300 | $50,600 | $121,700 |
| 2023 | $3,165 | $172,300 | $50,600 | $121,700 |
| 2022 | $2,976 | $172,300 | $50,600 | $121,700 |
| 2021 | $2,925 | $172,300 | $50,600 | $121,700 |
| 2020 | $2,857 | $172,300 | $50,600 | $121,700 |
| 2019 | $2,822 | $172,300 | $50,600 | $121,700 |
| 2018 | $2,791 | $172,300 | $50,600 | $121,700 |
| 2017 | $2,671 | $172,300 | $50,600 | $121,700 |
| 2016 | -- | $172,300 | $50,600 | $121,700 |
| 2015 | -- | $172,300 | $50,600 | $121,700 |
| 2014 | -- | $172,300 | $50,600 | $121,700 |
Source: Public Records
Map
Nearby Homes