
Seller's Agent in 2023
Janusz Gajda
RE/MAX
(201) 952-2222
7 in this area
69 Total Sales
Estimated Value: $670,000 - $743,000
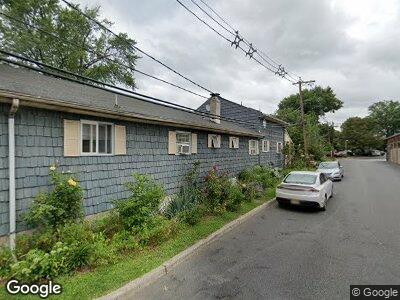
BEAUTIFUL 2 BRM APARTMENT, RECENTLY UPDATED & LOCATED 5 MIN WALKING DISTANCE TO NYC BUS STOP (160). THIS BRIGHT, 1ST FLOOR UNIT OFFERS LR, BRAND NEW KITCHEN W/BREAKFAST BAR & NEW STAINLESS STEEL APPLIANCES (GAS STOVE, HOOD, DISHWASHER & REFRIGERATOR), 2 BRMS, PLENTY OF CLOSETS & NICELY UPDATED FBTH. LAUNDRY HOOK-UPS IN THE BASEMENT & ATTIC STORAGE (PULL DOWN ATTIC LADDER). NO SMOKING. USE OF YARD & PLENTY OF STREET PARKING. SEPARATE UTILITIES. COLD WATER INCLUDED. PETS (DOGS ONLY, NO CATS) ARE CONDITIONAL & MUST BE APPROVED BY THE LANDLORD ON A CASE-BY-CASE BASIS. THE OWNER WILL CONSIDER A SMALL, WELL-TRAINED DOG. APPROX ROOM SIZES: LR(16X13), KIT(8X9), BR(11X10), BR(10X9). REQUIREMENTS: RENTSPREE APPLICATION, EMPLOYMENT VERIFICATION, REFERENCES, PROOF OF ABILITY TO PAY RENT, CREDIT CHECK(MINIMUM 700 FICO SCORE IS REQUIRED), INTERVIEW, 1.5 MONTH SECURITY & 1 MONTH BROKER'S FEE. MUST BE SEEN! WON'T LAST LONG.
| Date | Status | Borrower | Loan Amount |
|---|---|---|---|
| Closed | Gutowski Kezysztof | $364,000 | |
| Closed | Plosia Carolan | $544,185 | |
| Closed | Plosia James L | $115,000 |
| Date | Event | Price | Change | Sq Ft Price |
|---|---|---|---|---|
| 09/30/2023 09/30/23 | Rented | $2,150 | -2.3% | -- |
| 07/05/2023 07/05/23 | For Rent | $2,200 | 0.0% | -- |
| 03/01/2021 03/01/21 | Sold | $455,000 | +1.3% | $220 / Sq Ft |
| 01/20/2021 01/20/21 | Pending | -- | -- | -- |
| 01/04/2021 01/04/21 | For Sale | $449,000 | -- | $217 / Sq Ft |
| Year | Tax Paid | Tax Assessment Tax Assessment Total Assessment is a certain percentage of the fair market value that is determined by local assessors to be the total taxable value of land and additions on the property. | Land | Improvement |
|---|---|---|---|---|
| 2024 | $8,102 | $518,600 | $297,200 | $221,400 |
| 2023 | $7,930 | $499,200 | $285,000 | $214,200 |
| 2022 | $7,930 | $452,900 | $263,200 | $189,700 |
| 2021 | $6,926 | $402,700 | $239,000 | $163,700 |
| 2020 | $7,074 | $388,900 | $234,100 | $154,800 |
| 2019 | $7,176 | $391,700 | $231,400 | $160,300 |
| 2018 | $6,131 | $344,800 | $199,100 | $145,700 |
| 2017 | $6,378 | $307,500 | $181,400 | $126,100 |
| 2016 | $5,981 | $307,500 | $181,400 | $126,100 |
| 2015 | $5,799 | $307,500 | $181,400 | $126,100 |
| 2014 | $5,605 | $307,500 | $181,400 | $126,100 |
Seller's Agent in 2023
Janusz Gajda
RE/MAX
(201) 952-2222
7 in this area
69 Total Sales
K
Seller's Agent in 2021
Katherine Plosia
Terrie O'Connor Realtors-Hasbrouck Heights
(201) 445-2011
4 in this area
55 Total Sales