111 Redwood Rd Clinton, TN 37716
Estimated Value: $350,109 - $472,000
--
Bed
2
Baths
1,848
Sq Ft
$216/Sq Ft
Est. Value
About This Home
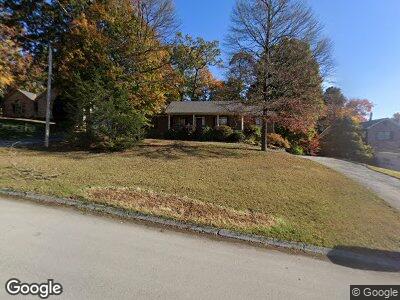
This home is located at 111 Redwood Rd, Clinton, TN 37716 and is currently estimated at $399,277, approximately $216 per square foot. 111 Redwood Rd is a home located in Anderson County with nearby schools including Clinton Elementary School.
Ownership History
Date
Name
Owned For
Owner Type
Purchase Details
Closed on
May 25, 2007
Sold by
Lollar Jamie L
Bought by
Schrider Matthew
Current Estimated Value
Home Financials for this Owner
Home Financials are based on the most recent Mortgage that was taken out on this home.
Original Mortgage
$143,900
Interest Rate
6.16%
Purchase Details
Closed on
Jul 14, 2004
Sold by
Fair Leisa W P
Bought by
Lollar Jamie L
Purchase Details
Closed on
Dec 20, 2000
Sold by
Phillips David A
Bought by
Phillips Leisa W
Purchase Details
Closed on
May 26, 1994
Sold by
Jetter John
Bought by
Phillips David
Purchase Details
Closed on
Jul 16, 1992
Bought by
Jetter John E and Jetter Wife Anne M
Purchase Details
Closed on
Nov 15, 1989
Bought by
Foust Eugene and Foust Wife Sue
Purchase Details
Closed on
Oct 23, 1989
Bought by
Disney Clyde
Create a Home Valuation Report for This Property
The Home Valuation Report is an in-depth analysis detailing your home's value as well as a comparison with similar homes in the area
Home Values in the Area
Average Home Value in this Area
Purchase History
| Date | Buyer | Sale Price | Title Company |
|---|---|---|---|
| Schrider Matthew | $179,900 | -- | |
| Lollar Jamie L | $145,900 | -- | |
| Phillips Leisa W | -- | -- | |
| Phillips David | -- | -- | |
| Jetter John E | $115,000 | -- | |
| Foust Eugene | $13,500 | -- | |
| Disney Clyde | $14,300 | -- |
Source: Public Records
Mortgage History
| Date | Status | Borrower | Loan Amount |
|---|---|---|---|
| Open | Schrider Matthew Derrin | $158,000 | |
| Closed | Schrider Matthew | $137,750 | |
| Closed | Schrider Matthew | $39,700 | |
| Closed | Disney Clyde | $143,900 | |
| Closed | Disney Clyde | $18,000 | |
| Previous Owner | Lollar Jamie L | $125,000 | |
| Previous Owner | Phillips Leisa W | $10,000 | |
| Previous Owner | Phillips Leisa W | $65,000 |
Source: Public Records
Tax History Compared to Growth
Tax History
| Year | Tax Paid | Tax Assessment Tax Assessment Total Assessment is a certain percentage of the fair market value that is determined by local assessors to be the total taxable value of land and additions on the property. | Land | Improvement |
|---|---|---|---|---|
| 2024 | $415 | $47,975 | $7,500 | $40,475 |
| 2023 | $1,248 | $47,975 | $0 | $0 |
| 2022 | $1,663 | $47,975 | $7,500 | $40,475 |
| 2021 | $1,663 | $47,975 | $7,500 | $40,475 |
| 2020 | $1,507 | $47,975 | $7,500 | $40,475 |
| 2019 | $1,548 | $40,750 | $7,500 | $33,250 |
| 2018 | $1,507 | $40,750 | $7,500 | $33,250 |
| 2017 | $1,507 | $40,750 | $7,500 | $33,250 |
| 2016 | $1,507 | $40,750 | $7,500 | $33,250 |
| 2015 | -- | $40,750 | $7,500 | $33,250 |
| 2014 | -- | $40,750 | $7,500 | $33,250 |
| 2013 | -- | $41,325 | $0 | $0 |
Source: Public Records
Map
Nearby Homes
- 102 Timbercrest Dr
- 128 Westwood Dr
- 102 Oakwood Dr
- 312 Westwood Dr
- 123 Carson Place
- 708 Byrd St
- 716 Byrd St
- 105 Highland Ave
- 816 Rogers St
- 517 N Main St
- 0 Longmire Rd
- 201 W Washington Ave
- 902 Mcadoo St
- 913 Loy St
- 917 Loy St
- 334 Marshall St
- 0 Marshall St
- 717 N Charles G Seivers Blvd
- 292 Carroll Hollow Rd
- 306 Dew St