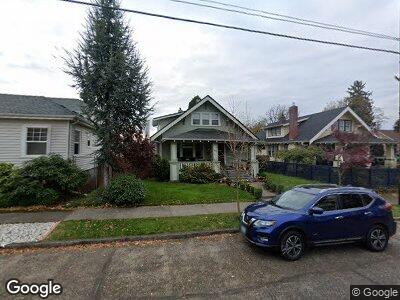
111 W 29th St Vancouver, WA 98660
Carter Park NeighborhoodEstimated Value: $675,000 - $788,000
3
Beds
2
Baths
2,780
Sq Ft
$264/Sq Ft
Est. Value
About This Home
This home is located at 111 W 29th St, Vancouver, WA 98660 and is currently estimated at $734,132, approximately $264 per square foot. 111 W 29th St is a home located in Clark County with nearby schools including Hough Elementary School, Discovery Middle School, and Hudson's Bay High School.
Ownership History
Date
Name
Owned For
Owner Type
Purchase Details
Closed on
Oct 26, 2015
Sold by
Avants London E and Avants Joni
Bought by
Desjarlais Zachery and Desjarlais Sarah
Current Estimated Value
Home Financials for this Owner
Home Financials are based on the most recent Mortgage that was taken out on this home.
Original Mortgage
$380,000
Interest Rate
3.87%
Mortgage Type
New Conventional
Purchase Details
Closed on
Apr 20, 2001
Sold by
Howard Joni
Bought by
Avants London E
Home Financials for this Owner
Home Financials are based on the most recent Mortgage that was taken out on this home.
Original Mortgage
$151,600
Interest Rate
6.98%
Purchase Details
Closed on
Oct 17, 1995
Sold by
Petrie George C and Majers Steven A
Bought by
Avants London and Howard Joni
Home Financials for this Owner
Home Financials are based on the most recent Mortgage that was taken out on this home.
Original Mortgage
$80,000
Interest Rate
7.67%
Mortgage Type
Seller Take Back
Create a Home Valuation Report for This Property
The Home Valuation Report is an in-depth analysis detailing your home's value as well as a comparison with similar homes in the area
Home Values in the Area
Average Home Value in this Area
Purchase History
| Date | Buyer | Sale Price | Title Company |
|---|---|---|---|
| Desjarlais Zachery | $400,000 | Cascade Title Company | |
| Avants London E | -- | Cascade Title | |
| Avants London | $90,000 | Chicago Title Insurance Co |
Source: Public Records
Mortgage History
| Date | Status | Borrower | Loan Amount |
|---|---|---|---|
| Open | Desjarlais Zachery | $160,000 | |
| Open | Desjarlais Zachery | $341,000 | |
| Closed | Desjarlais Zachery | $380,000 | |
| Previous Owner | Avants London E | $151,600 | |
| Previous Owner | Avants London | $80,000 | |
| Closed | Avants London | $10,000 |
Source: Public Records
Tax History Compared to Growth
Tax History
| Year | Tax Paid | Tax Assessment Tax Assessment Total Assessment is a certain percentage of the fair market value that is determined by local assessors to be the total taxable value of land and additions on the property. | Land | Improvement |
|---|---|---|---|---|
| 2025 | $5,968 | $618,897 | $218,500 | $400,397 |
| 2024 | $5,486 | $611,317 | $218,500 | $392,817 |
| 2023 | $5,434 | $586,778 | $209,000 | $377,778 |
| 2022 | $5,166 | $583,472 | $209,000 | $374,472 |
| 2021 | $4,982 | $516,742 | $190,000 | $326,742 |
| 2020 | $4,555 | $469,610 | $161,500 | $308,110 |
| 2019 | $3,941 | $444,886 | $152,000 | $292,886 |
| 2018 | $4,442 | $398,658 | $0 | $0 |
| 2017 | $3,930 | $373,082 | $0 | $0 |
| 2016 | $3,726 | $344,457 | $0 | $0 |
| 2015 | $3,587 | $312,106 | $0 | $0 |
| 2014 | -- | $284,093 | $0 | $0 |
| 2013 | -- | $242,614 | $0 | $0 |
Source: Public Records
Map
Nearby Homes