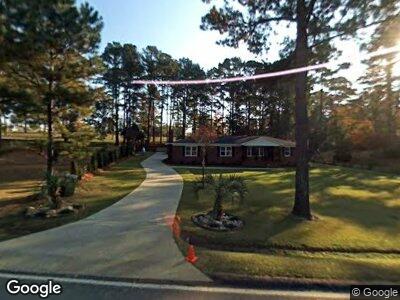
1112 Stanley Dr Augusta, GA 30909
West Augusta NeighborhoodEstimated Value: $237,000 - $382,000
3
Beds
2
Baths
1,947
Sq Ft
$165/Sq Ft
Est. Value
About This Home
This home is located at 1112 Stanley Dr, Augusta, GA 30909 and is currently estimated at $321,814, approximately $165 per square foot. 1112 Stanley Dr is a home located in Richmond County with nearby schools including A. Brian Merry Elementary School, Tutt Middle School, and Johnson Magnet.
Ownership History
Date
Name
Owned For
Owner Type
Purchase Details
Closed on
Feb 4, 2020
Sold by
Thacker Herman Lindsey
Bought by
Thacker Elizabeth A
Current Estimated Value
Create a Home Valuation Report for This Property
The Home Valuation Report is an in-depth analysis detailing your home's value as well as a comparison with similar homes in the area
Home Values in the Area
Average Home Value in this Area
Purchase History
| Date | Buyer | Sale Price | Title Company |
|---|---|---|---|
| Thacker Elizabeth A | -- | -- |
Source: Public Records
Tax History Compared to Growth
Tax History
| Year | Tax Paid | Tax Assessment Tax Assessment Total Assessment is a certain percentage of the fair market value that is determined by local assessors to be the total taxable value of land and additions on the property. | Land | Improvement |
|---|---|---|---|---|
| 2024 | $1,041 | $91,013 | $75,881 | $59,329 |
| 2023 | $1,041 | $132,545 | $75,881 | $56,664 |
| 2022 | $1,031 | $118,806 | $75,881 | $42,925 |
| 2021 | $1,119 | $118,761 | $75,881 | $42,880 |
| 2020 | $1,127 | $114,799 | $75,881 | $38,918 |
| 2019 | $1,184 | $114,799 | $75,881 | $38,918 |
| 2018 | $1,191 | $114,799 | $75,881 | $38,918 |
| 2017 | $806 | $114,263 | $75,881 | $38,382 |
| 2016 | $806 | $114,264 | $75,881 | $38,382 |
| 2015 | $806 | $114,264 | $75,881 | $38,382 |
| 2014 | $806 | $114,264 | $75,881 | $38,382 |
Source: Public Records
Map
Nearby Homes
- 1071 Alexander Dr
- 3033 Brookhaven Way
- 250 Lafayette Dr
- 1058 Bertram Rd
- 2705 Bolling Rd
- 219 Lafayette Dr
- 2609 Sherborne Ct
- 2016 Summer Valley Way
- 2001 Bromley Ct
- 2705 Rosewood Dr
- 2032 Buckhaven Way
- 912 Eisenhower Dr
- 1201 Summertime Place
- 2417 Wilkshire Dr
- 2677 York Dr
- 1217 Glenwood Dr
- 501 Ashland Dr
- 502 One Mill Place
- 2212 Woodbluff Way
- 2227 Woodbluff Way