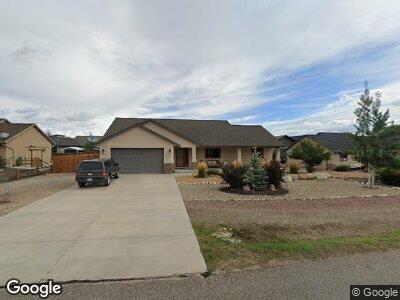
1114 E Sabeta Ave Poncha Springs, CO 81242
Estimated Value: $673,228 - $768,000
3
Beds
2
Baths
1,610
Sq Ft
$451/Sq Ft
Est. Value
About This Home
This home is located at 1114 E Sabeta Ave, Poncha Springs, CO 81242 and is currently estimated at $725,557, approximately $450 per square foot. 1114 E Sabeta Ave is a home located in Chaffee County with nearby schools including Longfellow Elementary School, Salida Middle School, and Salida High School.
Ownership History
Date
Name
Owned For
Owner Type
Purchase Details
Closed on
Nov 20, 2019
Sold by
Hall Stephen P and Hall Shann E
Bought by
Laws Willis Georgette V and Willis Barry K
Current Estimated Value
Purchase Details
Closed on
May 30, 2014
Sold by
D Snyder Construction Inc
Bought by
Hall Stephen P and Hall Shanna E
Home Financials for this Owner
Home Financials are based on the most recent Mortgage that was taken out on this home.
Original Mortgage
$299,881
Interest Rate
4.32%
Mortgage Type
VA
Purchase Details
Closed on
Jun 17, 2013
Sold by
Lee & Anita Albert Living Trust
Bought by
D Snyder Construction Inc
Home Financials for this Owner
Home Financials are based on the most recent Mortgage that was taken out on this home.
Original Mortgage
$45,000
Interest Rate
3.43%
Mortgage Type
Unknown
Create a Home Valuation Report for This Property
The Home Valuation Report is an in-depth analysis detailing your home's value as well as a comparison with similar homes in the area
Home Values in the Area
Average Home Value in this Area
Purchase History
| Date | Buyer | Sale Price | Title Company |
|---|---|---|---|
| Laws Willis Georgette V | $445,000 | None Available | |
| Hall Stephen P | $311,000 | First American Title Ins Co | |
| D Snyder Construction Inc | $45,000 | None Available |
Source: Public Records
Mortgage History
| Date | Status | Borrower | Loan Amount |
|---|---|---|---|
| Previous Owner | Hall Ii Stephen F | $321,770 | |
| Previous Owner | Hall Stephen P | $299,881 | |
| Previous Owner | D Snyder Construction Inc | $45,000 | |
| Previous Owner | D Snyder Construction Inc | $222,760 |
Source: Public Records
Tax History Compared to Growth
Tax History
| Year | Tax Paid | Tax Assessment Tax Assessment Total Assessment is a certain percentage of the fair market value that is determined by local assessors to be the total taxable value of land and additions on the property. | Land | Improvement |
|---|---|---|---|---|
| 2024 | $2,245 | $43,710 | $5,940 | $37,770 |
| 2023 | $2,186 | $43,710 | $5,940 | $37,770 |
| 2022 | $1,672 | $30,980 | $3,890 | $27,090 |
| 2021 | $1,680 | $31,870 | $4,000 | $27,870 |
| 2020 | $1,706 | $30,930 | $4,360 | $26,570 |
| 2019 | $1,709 | $30,930 | $4,360 | $26,570 |
| 2018 | $1,352 | $24,760 | $3,240 | $21,520 |
| 2017 | $1,321 | $24,760 | $3,240 | $21,520 |
| 2016 | $1,322 | $24,330 | $3,180 | $21,150 |
| 2015 | $631 | $24,330 | $3,180 | $21,150 |
| 2014 | $631 | $13,050 | $0 | $0 |
Source: Public Records
Map
Nearby Homes
- 1124 E Poncha Ave
- 1117 Agate Ln
- 1109 E Ouray Ave Unit 39
- 1107 E Ouray Ave Unit 38
- 1009 Fooses St
- 2102 E Ouray Ave
- 1112 Pinon Unit 91
- 1100 Pinon Dr
- 1117 Little River
- 1128 Little River Ln Unit 72
- 618 E Poncha Ave
- 1112 Caliente Ln
- 1115 Little River Ln Unit 78
- 1112 Poncha Springs Ln
- 1133 Caliente Ln Unit 117
- 10373 Hutchinson Ln
- 205 Sabeta Ave
- 10503 Willow Ave
- 10502 Willow Ave
- 126 Halleys Ave