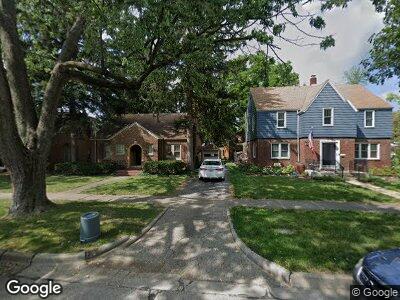
1114 W Healey St Champaign, IL 61821
Clark NeighborhoodEstimated Value: $239,609 - $254,000
3
Beds
2
Baths
1,436
Sq Ft
$172/Sq Ft
Est. Value
About This Home
This home is located at 1114 W Healey St, Champaign, IL 61821 and is currently estimated at $246,902, approximately $171 per square foot. 1114 W Healey St is a home located in Champaign County with nearby schools including Central High School, St. John Lutheran School, and Holy Cross Elementary School.
Ownership History
Date
Name
Owned For
Owner Type
Purchase Details
Closed on
May 9, 2024
Sold by
Kasten Michael S
Bought by
Quiroga Maria Salome Gonza and Pasquale Taylor D
Current Estimated Value
Home Financials for this Owner
Home Financials are based on the most recent Mortgage that was taken out on this home.
Original Mortgage
$228,000
Outstanding Balance
$226,725
Interest Rate
7.22%
Mortgage Type
New Conventional
Estimated Equity
$21,003
Purchase Details
Closed on
Jul 3, 2013
Sold by
Monfort Donna S
Bought by
Kasten Michael S
Home Financials for this Owner
Home Financials are based on the most recent Mortgage that was taken out on this home.
Original Mortgage
$124,000
Interest Rate
3.83%
Mortgage Type
New Conventional
Purchase Details
Closed on
Jul 14, 2006
Sold by
Monfort Donna S
Bought by
Monfort Donna S
Create a Home Valuation Report for This Property
The Home Valuation Report is an in-depth analysis detailing your home's value as well as a comparison with similar homes in the area
Home Values in the Area
Average Home Value in this Area
Purchase History
| Date | Buyer | Sale Price | Title Company |
|---|---|---|---|
| Quiroga Maria Salome Gonza | $240,000 | None Listed On Document | |
| Kasten Michael S | $155,000 | None Available | |
| Monfort Donna S | -- | None Available |
Source: Public Records
Mortgage History
| Date | Status | Borrower | Loan Amount |
|---|---|---|---|
| Open | Quiroga Maria Salome Gonza | $228,000 | |
| Previous Owner | Kasten Michael S | $124,000 | |
| Previous Owner | Monfort Donna A | $49,700 |
Source: Public Records
Tax History Compared to Growth
Tax History
| Year | Tax Paid | Tax Assessment Tax Assessment Total Assessment is a certain percentage of the fair market value that is determined by local assessors to be the total taxable value of land and additions on the property. | Land | Improvement |
|---|---|---|---|---|
| 2023 | $5,880 | $65,200 | $14,060 | $51,140 |
| 2022 | $4,980 | $60,150 | $12,970 | $47,180 |
| 2021 | $4,849 | $58,970 | $12,720 | $46,250 |
| 2020 | $4,648 | $56,700 | $12,230 | $44,470 |
| 2019 | $4,488 | $55,540 | $11,980 | $43,560 |
| 2018 | $4,379 | $54,660 | $11,790 | $42,870 |
| 2017 | $4,207 | $52,560 | $11,340 | $41,220 |
| 2016 | $3,762 | $51,480 | $11,110 | $40,370 |
| 2015 | $3,782 | $50,570 | $10,910 | $39,660 |
| 2014 | $3,749 | $50,570 | $10,910 | $39,660 |
| 2013 | $3,299 | $50,570 | $10,910 | $39,660 |
Source: Public Records
Map
Nearby Homes
- 513 S Chicago Ave
- 318 Elmwood Dr
- 506 S Edwin St
- 508 S Edwin St
- 514 S Edwin St
- 307 S Mckinley Ave
- 1215 W Healey St
- 505 S Ridgeway Ave
- 303 Elmwood Dr
- 511 S Russell St
- 913 W Union St
- 318 S Garfield Ave
- 1401 W Green St
- 915 W Clark St
- 909 Cheshire Dr Unit B
- 1604 W Springfield Ave
- 707 W White St
- 1301 W Hill St
- 1201 W Washington St
- 615 W Union St