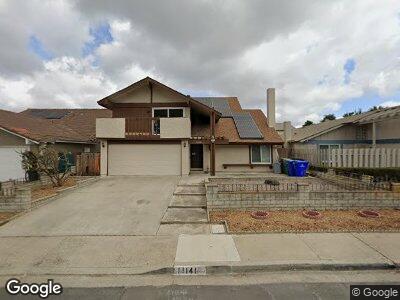
11141 Blythe Rd San Diego, CA 92126
Mira Mesa NeighborhoodEstimated Value: $1,170,000 - $1,344,000
5
Beds
3
Baths
2,138
Sq Ft
$579/Sq Ft
Est. Value
About This Home
This home is located at 11141 Blythe Rd, San Diego, CA 92126 and is currently estimated at $1,238,631, approximately $579 per square foot. 11141 Blythe Rd is a home located in San Diego County with nearby schools including Sandburg Elementary School, Challenger Middle School, and Mira Mesa High School.
Ownership History
Date
Name
Owned For
Owner Type
Purchase Details
Closed on
Apr 22, 2024
Sold by
Bond William and Bond Rebecca
Bought by
Jc New Land Llc and Lz Harvest Llc
Current Estimated Value
Purchase Details
Closed on
Jun 8, 2007
Sold by
Tabuena Isagani M and Tabuena Perla C
Bought by
Bond William and Bond Rebecca
Home Financials for this Owner
Home Financials are based on the most recent Mortgage that was taken out on this home.
Original Mortgage
$49,200
Interest Rate
6.41%
Mortgage Type
Unknown
Purchase Details
Closed on
Nov 15, 1999
Sold by
Tabuena Isagani M and Tabuena Perla C
Bought by
Tabuena Isagani M and Tabuena Perla C
Create a Home Valuation Report for This Property
The Home Valuation Report is an in-depth analysis detailing your home's value as well as a comparison with similar homes in the area
Home Values in the Area
Average Home Value in this Area
Purchase History
| Date | Buyer | Sale Price | Title Company |
|---|---|---|---|
| Jc New Land Llc | $1,054,000 | Corinthian Title | |
| Bond William | $492,000 | Commonwealth Land Title Co | |
| Tabuena Isagani M | -- | -- |
Source: Public Records
Mortgage History
| Date | Status | Borrower | Loan Amount |
|---|---|---|---|
| Previous Owner | Bond William | $90,000 | |
| Previous Owner | Bond William | $340,100 | |
| Previous Owner | Bond William | $49,200 | |
| Previous Owner | Bond William | $393,600 | |
| Previous Owner | Tabuena Isagani M | $57,000 | |
| Previous Owner | Tabuena Isagani M | $105,500 | |
| Previous Owner | Tabuena Isagani M | $47,000 | |
| Previous Owner | Tabuena Isagani M | $109,179 |
Source: Public Records
Tax History Compared to Growth
Tax History
| Year | Tax Paid | Tax Assessment Tax Assessment Total Assessment is a certain percentage of the fair market value that is determined by local assessors to be the total taxable value of land and additions on the property. | Land | Improvement |
|---|---|---|---|---|
| 2024 | $7,903 | $646,223 | $420,309 | $225,914 |
| 2023 | $7,726 | $633,553 | $412,068 | $221,485 |
| 2022 | $7,519 | $621,132 | $403,989 | $217,143 |
| 2021 | $7,465 | $608,954 | $396,068 | $212,886 |
| 2020 | $7,374 | $602,711 | $392,007 | $210,704 |
| 2019 | $7,240 | $590,894 | $384,321 | $206,573 |
| 2018 | $6,769 | $579,309 | $376,786 | $202,523 |
| 2017 | $80 | $567,951 | $369,399 | $198,552 |
| 2016 | $6,496 | $556,815 | $362,156 | $194,659 |
| 2015 | $6,124 | $525,000 | $373,000 | $152,000 |
| 2014 | $5,263 | $450,000 | $320,000 | $130,000 |
Source: Public Records
Map
Nearby Homes
- 11313 Zapata Ave Unit 6
- 8308 Menkar Rd
- 8503 Summerdale Rd Unit 375
- 7720 Tyrolean Rd
- 8508 Summerdale Rd Unit 19
- 7742 Parma Ln
- 11153 Acaso Way
- 11179 Kelowna Rd Unit 18
- 11189 Kelowna Rd Unit 50
- 8520 Summerdale Rd Unit 51
- 11187 Kelowna Rd Unit 73
- 8192 Torrell Way
- 10805 Camino Ruiz Unit 40
- 8358 New Salem St Unit 28
- 8479 Westmore Rd Unit 55
- 8613 Hydra Ln
- 10983 Via Abaca
- 11565 Caminito la Bar Unit 32
- 11595 Caminito la Bar Unit 3
- 11575 Caminito la Bar Unit 22