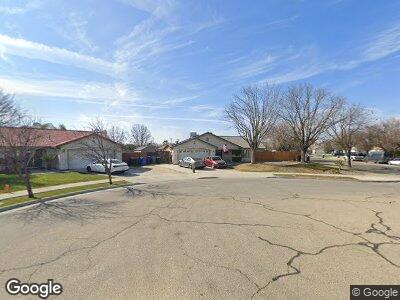
1115 Paris Place Lemoore, CA 93245
Estimated Value: $399,872 - $415,000
4
Beds
2
Baths
1,897
Sq Ft
$214/Sq Ft
Est. Value
About This Home
This home is located at 1115 Paris Place, Lemoore, CA 93245 and is currently estimated at $406,468, approximately $214 per square foot. 1115 Paris Place is a home located in Kings County with nearby schools including Meadow Lane Elementary School, Liberty Middle School, and Lemoore High School.
Ownership History
Date
Name
Owned For
Owner Type
Purchase Details
Closed on
Mar 20, 2007
Sold by
Berlanga Lupe and Berlanga Maria C
Bought by
Berlanga Lupe and Berlanga Maria C
Current Estimated Value
Home Financials for this Owner
Home Financials are based on the most recent Mortgage that was taken out on this home.
Original Mortgage
$48,500
Interest Rate
6.29%
Mortgage Type
Credit Line Revolving
Purchase Details
Closed on
Aug 6, 2003
Sold by
Roche Bryan and Roche Robyn
Bought by
Berlanga Lupe and Berlanga Maria C
Home Financials for this Owner
Home Financials are based on the most recent Mortgage that was taken out on this home.
Original Mortgage
$142,400
Interest Rate
5.99%
Mortgage Type
Purchase Money Mortgage
Purchase Details
Closed on
Oct 1, 1998
Sold by
Valley Vanguard Properties Inc
Bought by
Roche Bryan and Roche Robyn
Home Financials for this Owner
Home Financials are based on the most recent Mortgage that was taken out on this home.
Original Mortgage
$114,993
Interest Rate
6.61%
Create a Home Valuation Report for This Property
The Home Valuation Report is an in-depth analysis detailing your home's value as well as a comparison with similar homes in the area
Home Values in the Area
Average Home Value in this Area
Purchase History
| Date | Buyer | Sale Price | Title Company |
|---|---|---|---|
| Berlanga Lupe | -- | First American Title Co | |
| Berlanga Lupe | $178,000 | Chicago Title Company | |
| Roche Bryan | $119,000 | First American Title Co |
Source: Public Records
Mortgage History
| Date | Status | Borrower | Loan Amount |
|---|---|---|---|
| Open | Berlanga Lupe | $60,000 | |
| Closed | Berlanga Lupe | $48,500 | |
| Open | Berlanga Lupe | $260,000 | |
| Closed | Berlanga Lupe | $20,000 | |
| Closed | Berlanga Lupe | $200,000 | |
| Closed | Berlanga Lupe | $50,000 | |
| Closed | Berlanga Lupe | $7,500 | |
| Closed | Berlanga Lupe | $208,000 | |
| Closed | Berlanga Lupe | $142,400 | |
| Previous Owner | Roche Bryan | $114,993 | |
| Closed | Berlanga Lupe | $35,600 |
Source: Public Records
Tax History Compared to Growth
Tax History
| Year | Tax Paid | Tax Assessment Tax Assessment Total Assessment is a certain percentage of the fair market value that is determined by local assessors to be the total taxable value of land and additions on the property. | Land | Improvement |
|---|---|---|---|---|
| 2023 | $2,812 | $259,091 | $54,664 | $204,427 |
| 2022 | $2,941 | $254,012 | $53,593 | $200,419 |
| 2021 | $2,869 | $249,033 | $52,543 | $196,490 |
| 2020 | $2,853 | $246,479 | $52,004 | $194,475 |
| 2019 | $2,831 | $241,646 | $50,984 | $190,662 |
| 2018 | $2,667 | $236,908 | $49,984 | $186,924 |
| 2017 | $2,672 | $232,263 | $49,004 | $183,259 |
| 2016 | $2,521 | $227,709 | $48,043 | $179,666 |
| 2015 | $2,509 | $224,288 | $47,321 | $176,967 |
| 2014 | $2,439 | $219,894 | $46,394 | $173,500 |
Source: Public Records
Map
Nearby Homes
- 1024 Tranquility Ct
- 1022 Prosperity Dr
- 1113 Avalon Dr
- 1029 Freedom Dr
- 952 Privilege Way
- 952 Privilege Dr
- 912 Apple Ave
- 825 Bristol Cir
- 449 Camden Ct
- 1447 Orange St
- 1516 Lime Ct
- 413 W Burlwood Ln
- 1068 Hanover Ave
- 420 W Burlwood Ln
- 1629 Peachwood Cir
- 861 Eton Ave
- 660 N 19th Ave
- 190 W Burlwood Ln
- 135 W Burlwood Ln
- 725 Birch Ave