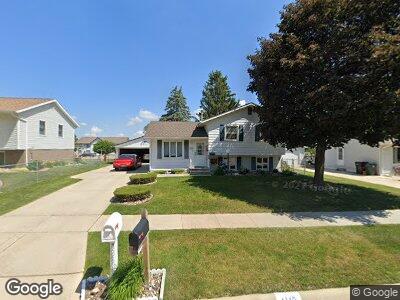
1118 Lilac Ln Cedar Falls, IA 50613
College Square NeighborhoodEstimated Value: $194,413 - $234,000
3
Beds
2
Baths
906
Sq Ft
$229/Sq Ft
Est. Value
About This Home
This home is located at 1118 Lilac Ln, Cedar Falls, IA 50613 and is currently estimated at $207,853, approximately $229 per square foot. 1118 Lilac Ln is a home located in Black Hawk County with nearby schools including Orchard Hill Elementary School, Peet Junior High School, and Cedar Falls High School.
Create a Home Valuation Report for This Property
The Home Valuation Report is an in-depth analysis detailing your home's value as well as a comparison with similar homes in the area
Home Values in the Area
Average Home Value in this Area
Tax History Compared to Growth
Tax History
| Year | Tax Paid | Tax Assessment Tax Assessment Total Assessment is a certain percentage of the fair market value that is determined by local assessors to be the total taxable value of land and additions on the property. | Land | Improvement |
|---|---|---|---|---|
| 2024 | $2,734 | $192,400 | $27,790 | $164,610 |
| 2023 | $2,678 | $192,400 | $27,790 | $164,610 |
| 2022 | $2,708 | $153,940 | $27,790 | $126,150 |
| 2021 | $2,534 | $153,940 | $27,790 | $126,150 |
| 2020 | $2,480 | $144,680 | $18,530 | $126,150 |
| 2019 | $2,480 | $144,680 | $18,530 | $126,150 |
| 2018 | $2,372 | $137,090 | $18,530 | $118,560 |
| 2017 | $2,248 | $137,090 | $18,530 | $118,560 |
| 2016 | $2,100 | $127,600 | $18,530 | $109,070 |
| 2015 | $2,100 | $127,600 | $18,530 | $109,070 |
| 2014 | $2,126 | $127,600 | $18,530 | $109,070 |
Source: Public Records
Map
Nearby Homes
- 3625 Briarwood Dr
- 3312 Pridemore Dr
- 3714 Eastpark Rd
- 3201 Pridemore Dr
- 3819 Eastpark Rd
- 1718 Maplewood Dr
- 4015 Eastpark Rd
- 2605 Valley Park Dr
- 2600 Waterloo Rd
- 4210 Orchard Hill Dr
- 2013 Maplewood Dr
- 225 Oregon Rd
- 4332 Spruce Creek Dr
- 4309 Briarwood Dr
- 4411 Briarwood Dr
- 128 Bergstrom Blvd
- 1920 Pleasant Dr
- 1002 Melrose Dr
- 4328 Spruce Creek Dr
- 3422 Clearview Dr