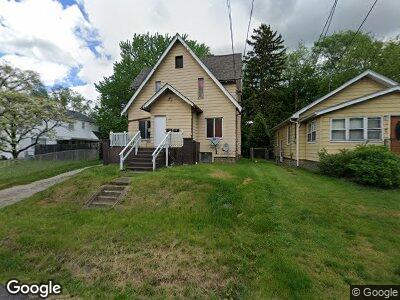
1119 Mcintosh Ave Unit A Akron, OH 44314
Kenmore NeighborhoodEstimated Value: $107,000 - $135,000
3
Beds
1
Bath
2,129
Sq Ft
$56/Sq Ft
Est. Value
About This Home
This home is located at 1119 Mcintosh Ave Unit A, Akron, OH 44314 and is currently estimated at $119,477, approximately $56 per square foot. 1119 Mcintosh Ave Unit A is a home located in Summit County with nearby schools including Imagine Akron Academy and Sam Salem Community Learning Center.
Ownership History
Date
Name
Owned For
Owner Type
Purchase Details
Closed on
Feb 2, 2024
Sold by
Sadie Property Management Llc
Bought by
Qilin Group Llc
Current Estimated Value
Purchase Details
Closed on
Oct 14, 2022
Sold by
Shrock David
Bought by
Avdee Eric and Sadie Property Management Llc
Purchase Details
Closed on
Mar 2, 2020
Sold by
Warner Robert A
Bought by
Shrock David
Purchase Details
Closed on
Feb 27, 2020
Sold by
Warner Robert A and Warner Suzanne G
Bought by
Shrock David
Purchase Details
Closed on
Apr 15, 2011
Sold by
Federal Home Loan Mortgage Corporation
Bought by
Warner Robert A
Purchase Details
Closed on
Mar 24, 2011
Sold by
Slagle Trent
Bought by
Federal Home Loan Mortgage Corp
Purchase Details
Closed on
Jul 30, 2002
Sold by
Mclaughlin James L
Bought by
Slagle Trent
Home Financials for this Owner
Home Financials are based on the most recent Mortgage that was taken out on this home.
Original Mortgage
$64,990
Interest Rate
6.62%
Create a Home Valuation Report for This Property
The Home Valuation Report is an in-depth analysis detailing your home's value as well as a comparison with similar homes in the area
Home Values in the Area
Average Home Value in this Area
Purchase History
| Date | Buyer | Sale Price | Title Company |
|---|---|---|---|
| Qilin Group Llc | $110,000 | None Listed On Document | |
| Avdee Eric | $84,000 | -- | |
| Shrock David | $34,000 | -- | |
| Shrock David | $34,000 | American Kingdom | |
| Warner Robert A | $17,500 | Attorney | |
| Federal Home Loan Mortgage Corp | $50,000 | None Available | |
| Slagle Trent | $67,000 | Guardian Title |
Source: Public Records
Mortgage History
| Date | Status | Borrower | Loan Amount |
|---|---|---|---|
| Previous Owner | Slagle Trent L | $40,000 | |
| Previous Owner | Slagle Trent | $64,990 |
Source: Public Records
Tax History Compared to Growth
Tax History
| Year | Tax Paid | Tax Assessment Tax Assessment Total Assessment is a certain percentage of the fair market value that is determined by local assessors to be the total taxable value of land and additions on the property. | Land | Improvement |
|---|---|---|---|---|
| 2025 | $3,426 | $30,293 | $4,690 | $25,603 |
| 2024 | $1,615 | $30,293 | $4,690 | $25,603 |
| 2023 | $3,426 | $30,293 | $4,690 | $25,603 |
| 2022 | $1,568 | $23,125 | $3,581 | $19,544 |
| 2021 | $1,570 | $23,125 | $3,581 | $19,544 |
| 2020 | $1,646 | $23,120 | $3,580 | $19,540 |
| 2019 | $1,444 | $18,220 | $4,050 | $14,170 |
| 2018 | $1,426 | $18,220 | $4,050 | $14,170 |
| 2017 | $1,438 | $18,220 | $4,050 | $14,170 |
| 2016 | $1,439 | $18,780 | $4,050 | $14,730 |
| 2015 | $1,438 | $18,780 | $4,050 | $14,730 |
| 2014 | $1,427 | $18,780 | $4,050 | $14,730 |
| 2013 | $1,731 | $23,490 | $4,050 | $19,440 |
Source: Public Records
Map
Nearby Homes
- 1147 Mcintosh Ave
- 1274 Welsh Ave
- 2389 29th St SW
- 1292 Tampa Ave
- 1235 Sevilla Ave
- 1350 Kentucky Ave
- 2470 East Ave
- 2983 Saralee Ave
- 2313 19th St SW
- 1200 Florida Ave
- 1248 Florida Ave
- 1143 Stanwood Ave
- 1165 Stanwood Ave
- 971 Sutherland Ave
- 172 & 173 Belcher Ave
- 1275 Lincoln Ct
- 2207 23rd St SW
- 923 Redfern Ave
- 52 Norwood St
- 2190 East Ave