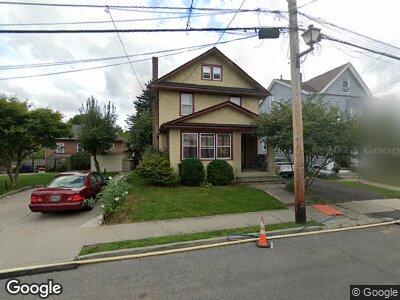
112 Rice Ave Sleepy Hollow, NY 10591
Sleepy Hollow Village NeighborhoodEstimated Value: $653,000 - $872,000
5
Beds
2
Baths
2,421
Sq Ft
$333/Sq Ft
Est. Value
About This Home
This home is located at 112 Rice Ave, Sleepy Hollow, NY 10591 and is currently estimated at $806,980, approximately $333 per square foot. 112 Rice Ave is a home located in Westchester County with nearby schools including John Paulding School, W L Morse School, and Washington Irving Interm School.
Ownership History
Date
Name
Owned For
Owner Type
Purchase Details
Closed on
Jun 17, 2015
Sold by
Link Shachara N and Howard Neva N
Bought by
Dupuis Erna Melanie
Current Estimated Value
Home Financials for this Owner
Home Financials are based on the most recent Mortgage that was taken out on this home.
Original Mortgage
$391,200
Outstanding Balance
$308,959
Interest Rate
3.83%
Mortgage Type
New Conventional
Estimated Equity
$498,021
Purchase Details
Closed on
Mar 30, 2009
Sold by
Fox Michael and Fox Mary Young
Bought by
Howard Neva N and Link Shachar N
Home Financials for this Owner
Home Financials are based on the most recent Mortgage that was taken out on this home.
Original Mortgage
$409,600
Interest Rate
4.93%
Mortgage Type
Purchase Money Mortgage
Purchase Details
Closed on
Oct 2, 2004
Sold by
Felix Jane Hogan and Armstrong Rodney
Bought by
Fox Michael and Young Fox Mary
Home Financials for this Owner
Home Financials are based on the most recent Mortgage that was taken out on this home.
Original Mortgage
$54,000
Interest Rate
5.68%
Mortgage Type
Credit Line Revolving
Create a Home Valuation Report for This Property
The Home Valuation Report is an in-depth analysis detailing your home's value as well as a comparison with similar homes in the area
Home Values in the Area
Average Home Value in this Area
Purchase History
| Date | Buyer | Sale Price | Title Company |
|---|---|---|---|
| Dupuis Erna Melanie | $489,000 | Judicial Title Insurance | |
| Howard Neva N | $512,000 | Record & Return Title Agency | |
| Fox Michael | $360,000 | National Attorneys Title Ins |
Source: Public Records
Mortgage History
| Date | Status | Borrower | Loan Amount |
|---|---|---|---|
| Open | Dupuis Erna Melanie | $391,200 | |
| Previous Owner | Howard Neva N | $409,600 | |
| Previous Owner | Fox Michael | $87,000 | |
| Previous Owner | Fox Michael | $50,000 | |
| Previous Owner | Fox Michael | $370,000 | |
| Previous Owner | Fox Michael | $54,000 |
Source: Public Records
Tax History Compared to Growth
Tax History
| Year | Tax Paid | Tax Assessment Tax Assessment Total Assessment is a certain percentage of the fair market value that is determined by local assessors to be the total taxable value of land and additions on the property. | Land | Improvement |
|---|---|---|---|---|
| 2024 | -- | $125,000 | $29,700 | $95,300 |
| 2023 | $15,311 | $125,000 | $29,700 | $95,300 |
| 2022 | $15,140 | $125,000 | $29,700 | $95,300 |
| 2021 | $14,859 | $125,000 | $29,700 | $95,300 |
| 2020 | $14,643 | $125,000 | $29,700 | $95,300 |
| 2019 | $1,772 | $125,000 | $29,700 | $95,300 |
| 2018 | $13,771 | $125,000 | $29,700 | $95,300 |
| 2017 | $0 | $125,000 | $29,700 | $95,300 |
| 2016 | $20,709 | $125,000 | $29,700 | $95,300 |
| 2015 | -- | $5,500 | $500 | $5,000 |
| 2014 | -- | $5,500 | $500 | $5,000 |
| 2013 | -- | $5,500 | $500 | $5,000 |
Source: Public Records
Map
Nearby Homes
- 118 Van Tassel Ave
- 207 Gordon Ave
- 20 Pine St
- 48 Dell St
- 40 Hudson Terrace
- 18 Gesner Place
- 18 Andrews Ln
- 208 Horseman Blvd Unit 44
- 11 Highland Ave
- 148 Beekman Ave
- 119 Depeyster St
- 181 Wilson Park Dr
- 124 Depeyster St
- 4 Lighthouse Landing Unit 418
- 4 Lighthouse Landing Unit 324
- 4 Lighthouse Landing Unit TH11
- 4 Lighthouse Landing Unit PH521
- 4 Lighthouse Landing Unit PH511
- 4 Lighthouse Landing Unit PH515
- 4 Lighthouse Landing Unit TH19