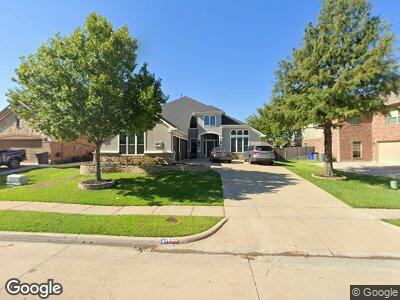
1122 Misty Meadow Dr Forney, TX 75126
Estimated Value: $368,000 - $428,000
4
Beds
3
Baths
2,677
Sq Ft
$146/Sq Ft
Est. Value
About This Home
This home is located at 1122 Misty Meadow Dr, Forney, TX 75126 and is currently estimated at $392,136, approximately $146 per square foot. 1122 Misty Meadow Dr is a home located in Kaufman County with nearby schools including Claybon Elementary School, Rhea Intermediate School, and Forney High School.
Ownership History
Date
Name
Owned For
Owner Type
Purchase Details
Closed on
Dec 23, 2015
Sold by
Gregory Jordan Neil and Gregory Krystle Marie
Bought by
Stafford Nathan and Stafford Traci Hayes
Current Estimated Value
Home Financials for this Owner
Home Financials are based on the most recent Mortgage that was taken out on this home.
Original Mortgage
$231,800
Interest Rate
4.03%
Mortgage Type
New Conventional
Purchase Details
Closed on
May 22, 2008
Sold by
Standard Pacific Of Texas Lp
Bought by
Gregory Jordan Neil and Gregory Krystle Marie
Home Financials for this Owner
Home Financials are based on the most recent Mortgage that was taken out on this home.
Original Mortgage
$240,452
Interest Rate
5.89%
Mortgage Type
Purchase Money Mortgage
Create a Home Valuation Report for This Property
The Home Valuation Report is an in-depth analysis detailing your home's value as well as a comparison with similar homes in the area
Home Values in the Area
Average Home Value in this Area
Purchase History
| Date | Buyer | Sale Price | Title Company |
|---|---|---|---|
| Stafford Nathan | -- | Allegiance Title Co | |
| Gregory Jordan Neil | -- | First American Title |
Source: Public Records
Mortgage History
| Date | Status | Borrower | Loan Amount |
|---|---|---|---|
| Open | Stafford Traci Hayes | $221,000 | |
| Closed | Stafford Traci Hayes | $221,000 | |
| Closed | Stafford Traci Hayes | $228,000 | |
| Closed | Stafford Nathan | $231,800 | |
| Previous Owner | Gregory Jordan Neil | $216,900 | |
| Previous Owner | Gregory Jordan Neil | $223,247 | |
| Previous Owner | Gregory Jordan Neil | $240,452 |
Source: Public Records
Tax History Compared to Growth
Tax History
| Year | Tax Paid | Tax Assessment Tax Assessment Total Assessment is a certain percentage of the fair market value that is determined by local assessors to be the total taxable value of land and additions on the property. | Land | Improvement |
|---|---|---|---|---|
| 2024 | $7,405 | $390,271 | -- | -- |
| 2023 | $6,471 | $354,792 | $0 | $0 |
| 2022 | $7,500 | $322,538 | $0 | $0 |
| 2021 | $7,443 | $299,522 | $70,000 | $229,522 |
| 2020 | $6,766 | $266,560 | $70,000 | $196,560 |
| 2019 | $7,871 | $274,270 | $70,000 | $204,270 |
| 2018 | $7,623 | $265,620 | $30,000 | $235,620 |
| 2017 | $7,387 | $254,750 | $30,000 | $224,750 |
| 2016 | $6,822 | $235,250 | $30,000 | $205,250 |
| 2015 | $5,754 | $200,400 | $30,000 | $170,400 |
| 2014 | $5,754 | $202,220 | $0 | $0 |
Source: Public Records
Map
Nearby Homes
- 1126 Misty Meadow Dr
- 3319 Meadow Leaf Rd
- 264 Palacios Place
- 213 Fox Hollow Blvd
- 1118 Ranger Rd
- 1299 Altuda Dr
- 1139 Hickory Park
- 111 Foggy Branch Trail
- 225 Redford Ln
- 284 Goliad Trail
- 221 Redford Ln
- 246 Westlake
- 1224 Altuda Dr
- 1233 Altuda Dr
- 221 Bugle Call Rd
- 251 Redford Ln
- 1213 Altuda Dr
- 321 Westlake
- 1113 Seguin Rd
- 117 Bugle Call Rd