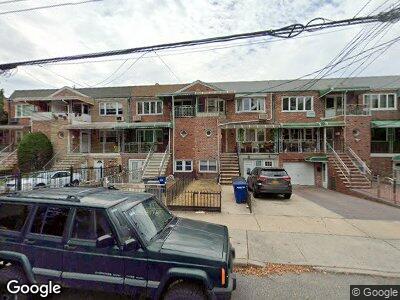
1124 E 58th St Brooklyn, NY 11234
Flatlands NeighborhoodEstimated Value: $982,000 - $1,242,285
8
Beds
4
Baths
3,432
Sq Ft
$328/Sq Ft
Est. Value
About This Home
This home is located at 1124 E 58th St, Brooklyn, NY 11234 and is currently estimated at $1,127,071, approximately $328 per square foot. 1124 E 58th St is a home located in Kings County with nearby schools including P.S. 203 Floyd Bennett, Success Academy Charter School - Bergen Beach, and St. Bernard Catholic Academy.
Ownership History
Date
Name
Owned For
Owner Type
Purchase Details
Closed on
Jun 9, 2006
Sold by
Peloso and Delores A
Bought by
Baptiste Jerry
Current Estimated Value
Home Financials for this Owner
Home Financials are based on the most recent Mortgage that was taken out on this home.
Original Mortgage
$139,000
Interest Rate
6.59%
Purchase Details
Closed on
Dec 12, 2003
Sold by
Brown Robert and Peloso Delores
Bought by
Peloso and Delores
Home Financials for this Owner
Home Financials are based on the most recent Mortgage that was taken out on this home.
Original Mortgage
$368,000
Interest Rate
5.67%
Mortgage Type
Purchase Money Mortgage
Purchase Details
Closed on
Nov 6, 1998
Sold by
Rindenau Helen
Bought by
Brown Robert and Peloso Delores
Home Financials for this Owner
Home Financials are based on the most recent Mortgage that was taken out on this home.
Original Mortgage
$290,650
Interest Rate
6.9%
Create a Home Valuation Report for This Property
The Home Valuation Report is an in-depth analysis detailing your home's value as well as a comparison with similar homes in the area
Home Values in the Area
Average Home Value in this Area
Purchase History
| Date | Buyer | Sale Price | Title Company |
|---|---|---|---|
| Baptiste Jerry | $695,000 | -- | |
| Baptiste Jerry | $695,000 | -- | |
| Peloso | -- | -- | |
| Peloso | -- | -- | |
| Brown Robert | $307,000 | -- | |
| Brown Robert | $307,000 | -- |
Source: Public Records
Mortgage History
| Date | Status | Borrower | Loan Amount |
|---|---|---|---|
| Open | Baptiste Jerry | $70,000 | |
| Previous Owner | Baptiste Jerry | $139,000 | |
| Previous Owner | Baptiste Jerry | $556,000 | |
| Previous Owner | Peloso Delores | $450,000 | |
| Previous Owner | Peloso | $368,000 | |
| Previous Owner | Brown Robert | $290,650 |
Source: Public Records
Tax History Compared to Growth
Tax History
| Year | Tax Paid | Tax Assessment Tax Assessment Total Assessment is a certain percentage of the fair market value that is determined by local assessors to be the total taxable value of land and additions on the property. | Land | Improvement |
|---|---|---|---|---|
| 2024 | $9,943 | $62,460 | $10,680 | $51,780 |
| 2023 | $9,979 | $67,020 | $10,680 | $56,340 |
| 2022 | $9,254 | $68,400 | $10,680 | $57,720 |
| 2021 | $9,203 | $56,820 | $10,680 | $46,140 |
| 2020 | $4,316 | $48,000 | $10,680 | $37,320 |
| 2019 | $8,630 | $44,880 | $10,680 | $34,200 |
| 2018 | $8,347 | $40,945 | $8,635 | $32,310 |
| 2017 | $7,874 | $38,628 | $9,922 | $28,706 |
| 2016 | $7,285 | $36,442 | $9,567 | $26,875 |
| 2015 | $4,775 | $34,380 | $11,880 | $22,500 |
| 2014 | $4,775 | $34,380 | $11,880 | $22,500 |
Source: Public Records
Map
Nearby Homes
- 1036 E 59th St
- 2042 Ralph Ave
- 5515 Avenue K
- 1205 E 55th St
- 1239 E 55th St
- 1072 E 73rd St Unit 3C
- 1086 E 73rd St Unit 75
- 1086 E 73rd St Unit 76
- 1093 E 72nd St Unit 13
- 1084 E 73rd St Unit 4
- 1258 E 56th St
- 1105 E 72nd St Unit 3C
- 5817 Avenue L
- 1121 E 55th St
- 1117 E 72nd St Unit 13
- 1121 E 72nd St Unit 14
- 1165 E 54th St Unit 3-K
- 1165 E 54th St Unit 6Z
- 1165 E 54th St Unit 5T
- 1165 E 54th St Unit 7Z