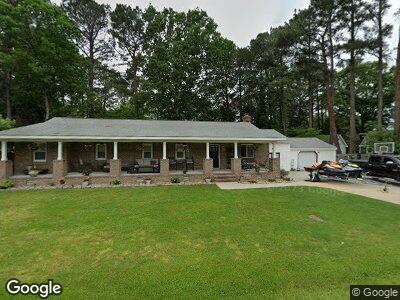
1129 Olive Rd Virginia Beach, VA 23464
Estimated Value: $516,000 - $547,000
4
Beds
3
Baths
2,450
Sq Ft
$216/Sq Ft
Est. Value
About This Home
This home is located at 1129 Olive Rd, Virginia Beach, VA 23464 and is currently estimated at $528,198, approximately $215 per square foot. 1129 Olive Rd is a home located in Virginia Beach City with nearby schools including Kempsville Elementary School, Kempsville Middle School, and Kempsville High School.
Ownership History
Date
Name
Owned For
Owner Type
Purchase Details
Closed on
Dec 21, 2023
Sold by
Beeson Charles M and Beeson Miranda S
Bought by
Roman Melissa S and Lopez Eduardo S
Current Estimated Value
Home Financials for this Owner
Home Financials are based on the most recent Mortgage that was taken out on this home.
Original Mortgage
$499,500
Interest Rate
7.44%
Mortgage Type
VA
Purchase Details
Closed on
Feb 16, 2010
Sold by
Us Bank National Asoc
Bought by
Beeson Charles M
Home Financials for this Owner
Home Financials are based on the most recent Mortgage that was taken out on this home.
Original Mortgage
$209,142
Interest Rate
5.5%
Mortgage Type
FHA
Purchase Details
Closed on
Dec 11, 2009
Sold by
Enoch Albert L
Bought by
Us Bank National Assoc
Create a Home Valuation Report for This Property
The Home Valuation Report is an in-depth analysis detailing your home's value as well as a comparison with similar homes in the area
Home Values in the Area
Average Home Value in this Area
Purchase History
| Date | Buyer | Sale Price | Title Company |
|---|---|---|---|
| Roman Melissa S | $499,500 | Fidelity National Title | |
| Beeson Charles M | $213,000 | -- | |
| Us Bank National Assoc | $178,500 | -- |
Source: Public Records
Mortgage History
| Date | Status | Borrower | Loan Amount |
|---|---|---|---|
| Open | Roman Melissa S | $508,126 | |
| Closed | Roman Melissa S | $499,500 | |
| Previous Owner | Beeson Charles M | $100,000 | |
| Previous Owner | Beeson Miranda S | $190,000 | |
| Previous Owner | Beeson Charles M | $209,142 |
Source: Public Records
Tax History Compared to Growth
Tax History
| Year | Tax Paid | Tax Assessment Tax Assessment Total Assessment is a certain percentage of the fair market value that is determined by local assessors to be the total taxable value of land and additions on the property. | Land | Improvement |
|---|---|---|---|---|
| 2024 | $4,642 | $468,900 | $165,000 | $303,900 |
| 2023 | $4,108 | $414,900 | $162,000 | $252,900 |
| 2022 | $3,765 | $380,300 | $137,500 | $242,800 |
| 2021 | $3,152 | $318,400 | $110,000 | $208,400 |
| 2020 | $3,311 | $325,400 | $103,000 | $222,400 |
| 2019 | $3,308 | $261,000 | $103,000 | $158,000 |
| 2018 | $2,617 | $261,000 | $103,000 | $158,000 |
| 2017 | $2,617 | $261,000 | $103,000 | $158,000 |
| 2016 | $2,467 | $249,200 | $103,000 | $146,200 |
| 2015 | $2,427 | $245,200 | $108,900 | $136,300 |
| 2014 | $2,244 | $241,300 | $122,100 | $119,200 |
Source: Public Records
Map
Nearby Homes
- 5305 Kempsville Ct
- 1220 Kempsville Rd
- 1129 Lord Dunmore Dr
- 5173 Langston Rd
- 1244 Lord Dunmore Dr
- 5137 Stratford Chase Dr
- 1448 Talisman Cir
- 1408 Lakeland Ct
- 987 Autumn Harvest Dr
- 5421 Whitehurst Arch
- 5108 Elton Ct Unit X3060
- 5436 Whitehurst Arch
- 968 Lord Dunmore Dr
- 5262 Waller Ct
- 5029 Denny Dr
- 1056 Mill Pond Ct
- 970 Whitehurst Landing Rd
- 5465 Indian River Rd
- 1536 Coolspring Way
- 5008 Christian Cir