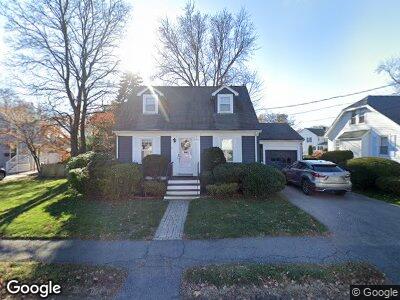
113 Alexander Ave Belmont, MA 02478
Belmont Center NeighborhoodEstimated Value: $1,024,000 - $1,157,881
2
Beds
2
Baths
957
Sq Ft
$1,126/Sq Ft
Est. Value
About This Home
This home is located at 113 Alexander Ave, Belmont, MA 02478 and is currently estimated at $1,077,470, approximately $1,125 per square foot. 113 Alexander Ave is a home located in Middlesex County with nearby schools including Winn Brook Elementary School, Winthrop L Chenery Middle School, and Belmont High School.
Ownership History
Date
Name
Owned For
Owner Type
Purchase Details
Closed on
Nov 17, 2023
Sold by
Ford Maureen B
Bought by
Maureen Ford Ret and Ford
Current Estimated Value
Purchase Details
Closed on
Jan 30, 1997
Sold by
Hassan Tariq A and Hassan Diane D
Bought by
Ford Maureen B
Home Financials for this Owner
Home Financials are based on the most recent Mortgage that was taken out on this home.
Original Mortgage
$150,000
Interest Rate
7.65%
Mortgage Type
Purchase Money Mortgage
Purchase Details
Closed on
Jun 30, 1989
Sold by
Direnzo Robert C
Bought by
Hassan Tariq A
Home Financials for this Owner
Home Financials are based on the most recent Mortgage that was taken out on this home.
Original Mortgage
$237,500
Interest Rate
10.38%
Create a Home Valuation Report for This Property
The Home Valuation Report is an in-depth analysis detailing your home's value as well as a comparison with similar homes in the area
Home Values in the Area
Average Home Value in this Area
Purchase History
| Date | Buyer | Sale Price | Title Company |
|---|---|---|---|
| Maureen Ford Ret | -- | None Available | |
| Ford Maureen B | $254,000 | -- | |
| Ford Maureen B | $254,000 | -- | |
| Hassan Tariq A | $125,435 | -- | |
| Hassan Tariq A | $125,435 | -- |
Source: Public Records
Mortgage History
| Date | Status | Borrower | Loan Amount |
|---|---|---|---|
| Previous Owner | Hassan Tariq A | $150,000 | |
| Previous Owner | Hassan Tariq A | $237,500 |
Source: Public Records
Tax History Compared to Growth
Tax History
| Year | Tax Paid | Tax Assessment Tax Assessment Total Assessment is a certain percentage of the fair market value that is determined by local assessors to be the total taxable value of land and additions on the property. | Land | Improvement |
|---|---|---|---|---|
| 2025 | $11,344 | $996,000 | $715,000 | $281,000 |
| 2024 | $11,331 | $1,073,000 | $842,000 | $231,000 |
| 2023 | $11,926 | $1,061,000 | $841,000 | $220,000 |
| 2022 | $10,728 | $928,000 | $770,000 | $158,000 |
| 2021 | $7,032 | $894,000 | $762,000 | $132,000 |
| 2020 | $4,924 | $882,000 | $750,000 | $132,000 |
| 2019 | $6,672 | $713,000 | $581,000 | $132,000 |
| 2018 | $7,958 | $655,000 | $523,000 | $132,000 |
| 2017 | $5,704 | $612,000 | $480,000 | $132,000 |
| 2016 | $7,674 | $611,000 | $480,000 | $131,000 |
| 2015 | $7,121 | $552,000 | $407,000 | $145,000 |
Source: Public Records
Map
Nearby Homes