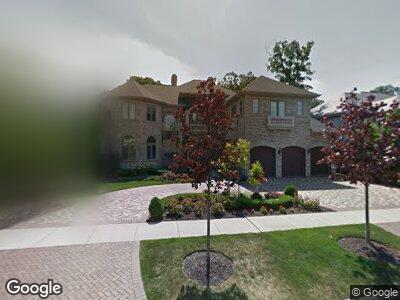
113 Carmela Ct Bloomingdale, IL 60108
Estimated Value: $1,613,000 - $1,893,000
4
Beds
7
Baths
7,900
Sq Ft
$226/Sq Ft
Est. Value
About This Home
This home is located at 113 Carmela Ct, Bloomingdale, IL 60108 and is currently estimated at $1,788,751, approximately $226 per square foot. 113 Carmela Ct is a home located in DuPage County with nearby schools including Erickson Elementary School, Westfield Middle School, and Lake Park High School.
Ownership History
Date
Name
Owned For
Owner Type
Purchase Details
Closed on
Oct 23, 2020
Sold by
Itrich Thomas J and Thomas J Itrich Trust
Bought by
Latoria General Partnership
Current Estimated Value
Purchase Details
Closed on
Feb 6, 2009
Sold by
Itrich Thomas J
Bought by
Itrich Thomas J and Itrich Donna Lee
Home Financials for this Owner
Home Financials are based on the most recent Mortgage that was taken out on this home.
Original Mortgage
$388,900
Interest Rate
4.69%
Mortgage Type
Stand Alone Refi Refinance Of Original Loan
Purchase Details
Closed on
Dec 6, 2006
Sold by
Itrich Thomas J and Itrich Donna Lee
Bought by
Itrich Thomas J
Purchase Details
Closed on
Feb 20, 2004
Sold by
Parkway Bank & Trust Co
Bought by
Itrich Thomas J and Itrich Donna Lee
Create a Home Valuation Report for This Property
The Home Valuation Report is an in-depth analysis detailing your home's value as well as a comparison with similar homes in the area
Home Values in the Area
Average Home Value in this Area
Purchase History
| Date | Buyer | Sale Price | Title Company |
|---|---|---|---|
| Latoria General Partnership | -- | Attorney | |
| Itrich Thomas J | -- | National Builder & Bancorp T | |
| Itrich Thomas J | -- | None Available | |
| Itrich Thomas J | $357,000 | First American Title |
Source: Public Records
Mortgage History
| Date | Status | Borrower | Loan Amount |
|---|---|---|---|
| Previous Owner | Itrich Thomas J | $353,000 | |
| Previous Owner | Itrich Thomas J | $381,000 | |
| Previous Owner | Itrich Thomas J | $388,900 | |
| Previous Owner | Itrich Thomas J | $400,000 | |
| Previous Owner | Nitti Frank | $451,778 |
Source: Public Records
Tax History Compared to Growth
Tax History
| Year | Tax Paid | Tax Assessment Tax Assessment Total Assessment is a certain percentage of the fair market value that is determined by local assessors to be the total taxable value of land and additions on the property. | Land | Improvement |
|---|---|---|---|---|
| 2023 | $40,754 | $541,790 | $74,190 | $467,600 |
| 2022 | $39,448 | $538,280 | $73,710 | $464,570 |
| 2021 | $38,043 | $511,430 | $70,030 | $441,400 |
| 2020 | $38,462 | $498,950 | $68,320 | $430,630 |
| 2019 | $37,240 | $479,480 | $65,650 | $413,830 |
| 2018 | $38,277 | $499,550 | $63,940 | $435,610 |
| 2017 | $36,377 | $463,010 | $59,260 | $403,750 |
| 2016 | $35,171 | $428,510 | $54,840 | $373,670 |
| 2015 | $34,776 | $399,880 | $51,180 | $348,700 |
| 2014 | $35,788 | $399,880 | $51,180 | $348,700 |
| 2013 | $35,296 | $413,570 | $52,930 | $360,640 |
Source: Public Records
Map
Nearby Homes
- 23W638 Goodridge Terrace
- 178 W Lake St
- 74 Royal Ln
- 234 Garden Way
- 464 Winterwood Dr
- 206 Eric Ct Unit 8
- 166 W Lake St
- 124 Day St Unit 211
- 1 Bloomingdale Place Unit 507
- 1 Bloomingdale Place Unit 617
- 1 Bloomingdale Place Unit 509
- 1 Bloomingdale Place Unit 101
- 1 Bloomingdale Place Unit 511
- 550 Lake St
- 104 Villa Way
- 157 Constitution Dr
- 219 Donmor Dr
- 134 Country Club Dr
- 23W510 Walnut St
- 6N160 Garden Ave