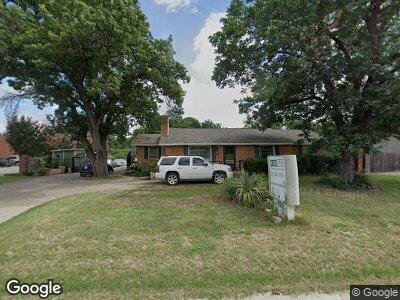
113 E Park Row Dr Arlington, TX 76010
Heart of Arlington NeighborhoodEstimated Value: $267,000 - $355,000
--
Bed
--
Bath
1,736
Sq Ft
$170/Sq Ft
Est. Value
About This Home
This home is located at 113 E Park Row Dr, Arlington, TX 76010 and is currently estimated at $295,897, approximately $170 per square foot. 113 E Park Row Dr is a home with nearby schools including Blanton Elementary School, Carter Junior High School, and Arlington High School.
Ownership History
Date
Name
Owned For
Owner Type
Purchase Details
Closed on
Jun 1, 1998
Sold by
Hart Kenneth A and Hart Donna L
Bought by
Van Hoa and Cadata
Current Estimated Value
Home Financials for this Owner
Home Financials are based on the most recent Mortgage that was taken out on this home.
Original Mortgage
$50,000
Interest Rate
7.27%
Create a Home Valuation Report for This Property
The Home Valuation Report is an in-depth analysis detailing your home's value as well as a comparison with similar homes in the area
Home Values in the Area
Average Home Value in this Area
Purchase History
| Date | Buyer | Sale Price | Title Company |
|---|---|---|---|
| Van Hoa | -- | -- |
Source: Public Records
Mortgage History
| Date | Status | Borrower | Loan Amount |
|---|---|---|---|
| Closed | Van Hoa | $50,000 |
Source: Public Records
Tax History Compared to Growth
Tax History
| Year | Tax Paid | Tax Assessment Tax Assessment Total Assessment is a certain percentage of the fair market value that is determined by local assessors to be the total taxable value of land and additions on the property. | Land | Improvement |
|---|---|---|---|---|
| 2024 | $3,714 | $281,810 | $46,900 | $234,910 |
| 2023 | $4,858 | $271,530 | $46,900 | $224,630 |
| 2022 | $4,977 | $234,344 | $42,250 | $192,094 |
| 2021 | $4,727 | $181,936 | $42,250 | $139,686 |
| 2020 | $4,286 | $171,004 | $42,250 | $128,754 |
| 2019 | $4,031 | $155,143 | $30,000 | $125,143 |
| 2018 | $3,551 | $157,538 | $101,400 | $56,138 |
| 2017 | $4,193 | $157,538 | $101,400 | $56,138 |
| 2016 | $4,193 | $157,538 | $135,200 | $22,338 |
| 2015 | $3,747 | $157,490 | $101,400 | $56,090 |
| 2014 | $3,747 | $157,490 | $101,400 | $56,090 |
Source: Public Records
Map
Nearby Homes
- 203 Ray St
- 707 Biggs Terrace
- 407 E Inwood Dr
- 1330 S Pecan St
- 1100 Sunnyvale Dr
- 1910 Meadow Ln
- 1109 Belvedere Dr
- 903 E Lovers Ln
- 1205 Belvedere Dr
- 1503 Wynn Terrace
- 1107 S Oak St
- 507 E Lilly Ln
- 420 E Lilly Ln
- 957 Meadow Oaks Dr
- 106 W Lilly Ln
- 515 Lynda Ln
- 409 E Lavender Ln
- 1102 E Lovers Ln
- 1415 Swiss St
- 1526 Daniel Dr