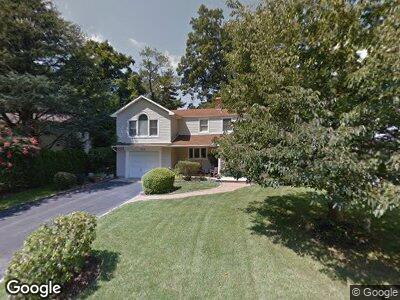
113 Pinetree Ln Roslyn Heights, NY 11577
Albertson NeighborhoodEstimated Value: $1,528,000
4
Beds
4
Baths
3,000
Sq Ft
$509/Sq Ft
Est. Value
About This Home
This home is located at 113 Pinetree Ln, Roslyn Heights, NY 11577 and is currently estimated at $1,528,000, approximately $509 per square foot. 113 Pinetree Ln is a home located in Nassau County with nearby schools including Jackson Avenue School, Mineola Middle School, and Mineola High School.
Ownership History
Date
Name
Owned For
Owner Type
Purchase Details
Closed on
Feb 12, 2015
Sold by
Paniccia Enrico and Paniccia Jeanne
Bought by
Tchilingarian Arusyak and Tchilingarian Grigor
Current Estimated Value
Purchase Details
Closed on
May 26, 1999
Sold by
Hsbc Bank Usa
Bought by
Paniccia Enrico and Paniccia Jeanne
Home Financials for this Owner
Home Financials are based on the most recent Mortgage that was taken out on this home.
Original Mortgage
$284,000
Interest Rate
6.85%
Purchase Details
Closed on
Apr 30, 1999
Home Financials for this Owner
Home Financials are based on the most recent Mortgage that was taken out on this home.
Original Mortgage
$284,000
Interest Rate
6.85%
Purchase Details
Closed on
Apr 27, 1999
Sold by
Hsbc Bank Usa
Bought by
Paniccia Enrico and Paniccia Jeanne
Home Financials for this Owner
Home Financials are based on the most recent Mortgage that was taken out on this home.
Original Mortgage
$284,000
Interest Rate
6.85%
Purchase Details
Closed on
Apr 30, 1998
Sold by
Lapp Esq Charles E
Bought by
Marine Midland Bank
Create a Home Valuation Report for This Property
The Home Valuation Report is an in-depth analysis detailing your home's value as well as a comparison with similar homes in the area
Home Values in the Area
Average Home Value in this Area
Purchase History
| Date | Buyer | Sale Price | Title Company |
|---|---|---|---|
| Tchilingarian Arusyak | $765,000 | None Available | |
| Paniccia Enrico | $355,000 | -- | |
| -- | $300,000 | -- |
Source: Public Records
Mortgage History
| Date | Status | Borrower | Loan Amount |
|---|---|---|---|
| Open | Tchililngarian Martiros | $444,000 |
Source: Public Records
Tax History Compared to Growth
Tax History
| Year | Tax Paid | Tax Assessment Tax Assessment Total Assessment is a certain percentage of the fair market value that is determined by local assessors to be the total taxable value of land and additions on the property. | Land | Improvement |
|---|---|---|---|---|
| 2024 | $5,493 | $851 | $378 | $473 |
| 2023 | $17,795 | $892 | $396 | $496 |
| 2022 | $17,795 | $892 | $396 | $496 |
| 2021 | $17,520 | $889 | $395 | $494 |
| 2020 | $17,429 | $1,148 | $894 | $254 |
| 2019 | $16,102 | $1,230 | $871 | $359 |
| 2018 | $16,284 | $1,312 | $0 | $0 |
| 2017 | $10,861 | $1,353 | $850 | $503 |
| 2016 | $16,100 | $1,525 | $958 | $567 |
| 2015 | $5,700 | $1,525 | $958 | $567 |
| 2014 | $5,700 | $1,525 | $958 | $567 |
| 2013 | $5,413 | $1,525 | $958 | $567 |
Source: Public Records
Map
Nearby Homes