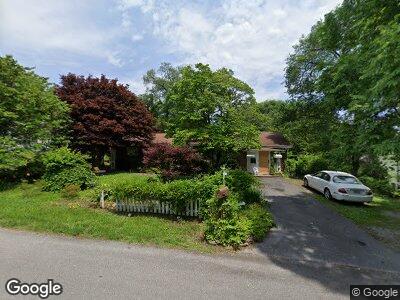
113 Ridge Rd Bristol, TN 37620
Estimated Value: $217,662 - $317,000
--
Bed
2
Baths
1,580
Sq Ft
$179/Sq Ft
Est. Value
About This Home
This home is located at 113 Ridge Rd, Bristol, TN 37620 and is currently estimated at $282,916, approximately $179 per square foot. 113 Ridge Rd is a home located in Sullivan County with nearby schools including Haynesfield Elementary School, Vance Middle School, and Tennessee High School.
Create a Home Valuation Report for This Property
The Home Valuation Report is an in-depth analysis detailing your home's value as well as a comparison with similar homes in the area
Home Values in the Area
Average Home Value in this Area
Mortgage History
| Date | Status | Borrower | Loan Amount |
|---|---|---|---|
| Closed | Cliffie Stiltner | $82,000 |
Source: Public Records
Tax History Compared to Growth
Tax History
| Year | Tax Paid | Tax Assessment Tax Assessment Total Assessment is a certain percentage of the fair market value that is determined by local assessors to be the total taxable value of land and additions on the property. | Land | Improvement |
|---|---|---|---|---|
| 2024 | -- | $35,825 | $3,150 | $32,675 |
| 2023 | $1,574 | $35,825 | $3,150 | $32,675 |
| 2022 | $1,574 | $35,825 | $3,150 | $32,675 |
| 2021 | $1,574 | $35,825 | $3,150 | $32,675 |
| 2020 | $1,514 | $35,825 | $3,150 | $32,675 |
| 2019 | $1,514 | $32,000 | $3,150 | $28,850 |
| 2018 | $1,508 | $32,000 | $3,150 | $28,850 |
| 2017 | $1,508 | $32,000 | $3,150 | $28,850 |
| 2016 | $1,370 | $28,400 | $3,150 | $25,250 |
| 2014 | $1,294 | $28,406 | $0 | $0 |
Source: Public Records
Map
Nearby Homes
- 116 Elk Rd
- 1616 Pershing Ave
- 308 Belmont Dr
- 116 W Crown
- 512 Henry St
- 122 Meadow Rd
- 112 Hidden Valley Rd
- 419 Cedar Valley Rd
- 146 Cloudland Dr
- 205 Lavinder Ln
- 111 Auburn St
- 504 W Cedar St
- 1231 6th Street Extension
- 515 1/2 Queen St
- 908 Weaver Pike
- 207 Sparger Rd
- 931 Weaver Pike
- 908 Columbia Rd
- 100 Earlway Rd
- 1037 5th St