
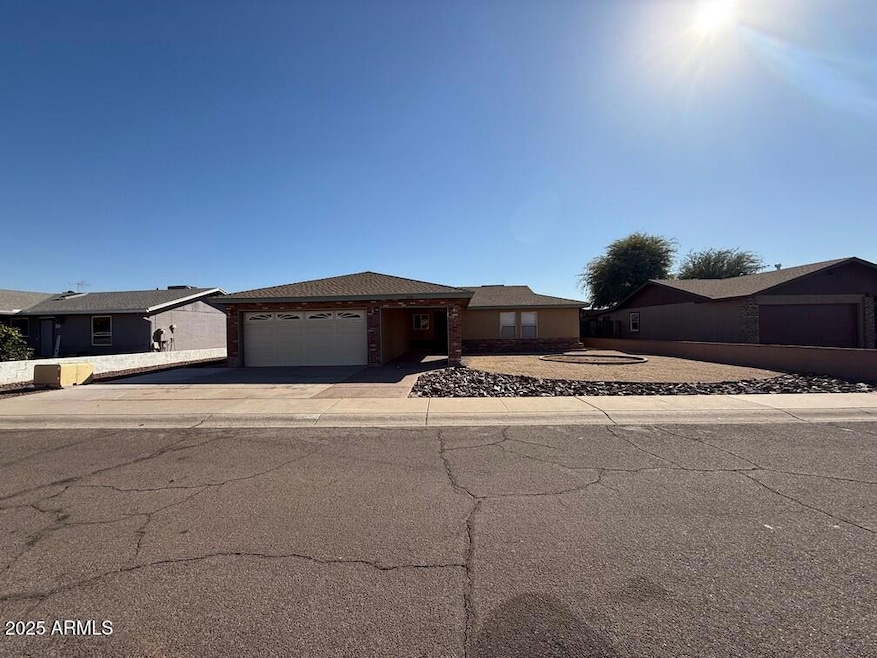

113 W Bluefield Ave Phoenix, AZ 85023
North Central Phoenix NeighborhoodEstimated payment $2,319/month
Total Views
7,731
3
Beds
2
Baths
1,687
Sq Ft
$231
Price per Sq Ft
Highlights
- 1 Fireplace
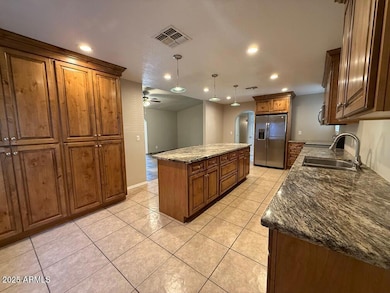
- Eat-In Kitchen
- Heating Available
- No HOA
- Cooling Available
- 1-Story Property
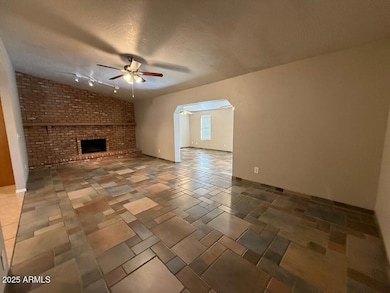
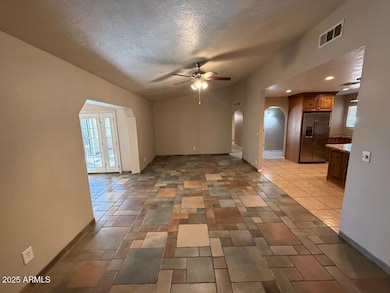
About This Home
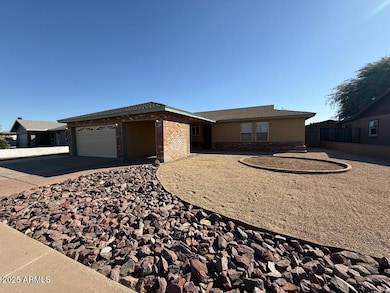
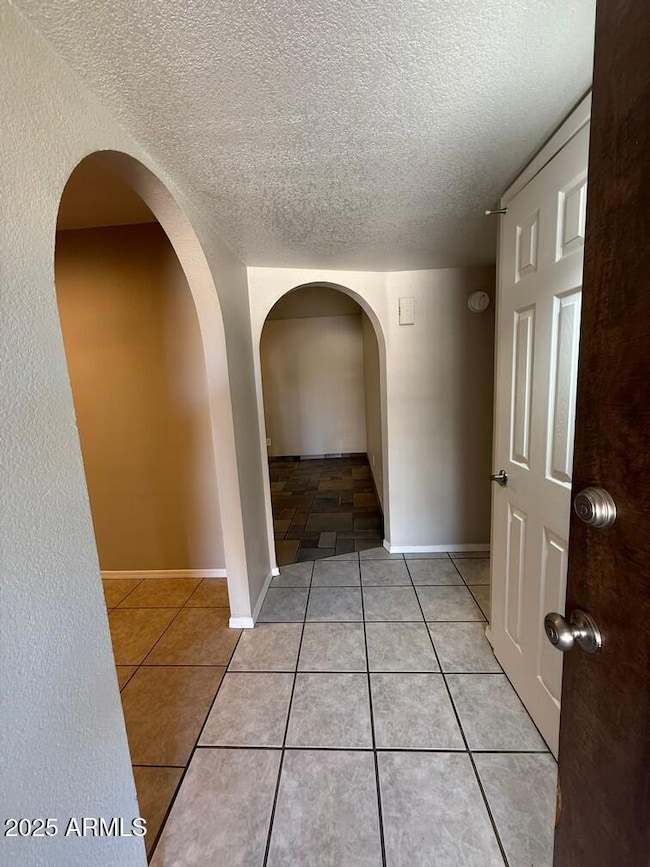
Charming 3-bedroom, 2-bathroom home in Phoenix featuring 1,687 sqft of living space on a spacious 6,744 sqft lot. Built in 1983, this home offers a comfortable layout with plenty of natural light. The large backyard provides ample space for outdoor entertaining or future customization. A 2-car garage offers convenience and extra storage. Located in a desirable neighborhood near schools, shopping, and dining, this home is a fantastic opportunity for those looking for space and potential in a great location.
Home Details
Home Type
- Single Family
Est. Annual Taxes
- $1,699
Year Built
- Built in 1983
Lot Details
- 6,744 Sq Ft Lot
- Desert faces the front and back of the property
- Block Wall Fence
Parking
- 2 Car Garage
Home Design
- Composition Roof
- Block Exterior
Interior Spaces
- 1,687 Sq Ft Home
- 1-Story Property
- 1 Fireplace
- Washer and Dryer Hookup
Kitchen
- Eat-In Kitchen
- Breakfast Bar
Bedrooms and Bathrooms
- 3 Bedrooms
- 2 Bathrooms
Schools
- Cactus View Elementary School
- Vista Verde Middle School
- North Canyon High School
Utilities
- Cooling Available
- Heating Available
Community Details
- No Home Owners Association
- Association fees include no fees
- Deer Valley Estates Unit 10 A Subdivision
Listing and Financial Details
- Tax Lot 28
- Assessor Parcel Number 208-02-032
Map
Create a Home Valuation Report for This Property
The Home Valuation Report is an in-depth analysis detailing your home's value as well as a comparison with similar homes in the area
Home Values in the Area
Average Home Value in this Area
Tax History
| Year | Tax Paid | Tax Assessment Tax Assessment Total Assessment is a certain percentage of the fair market value that is determined by local assessors to be the total taxable value of land and additions on the property. | Land | Improvement |
|---|---|---|---|---|
| 2025 | $1,699 | $17,068 | -- | -- |
| 2024 | $1,663 | $16,256 | -- | -- |
| 2023 | $1,663 | $29,210 | $5,840 | $23,370 |
| 2022 | $1,647 | $22,550 | $4,510 | $18,040 |
| 2021 | $1,652 | $20,550 | $4,110 | $16,440 |
| 2020 | $1,601 | $20,180 | $4,030 | $16,150 |
| 2019 | $1,603 | $18,860 | $3,770 | $15,090 |
| 2018 | $1,550 | $17,080 | $3,410 | $13,670 |
| 2017 | $1,265 | $15,210 | $3,040 | $12,170 |
| 2016 | $1,245 | $14,670 | $2,930 | $11,740 |
| 2015 | $866 | $11,820 | $2,360 | $9,460 |
Source: Public Records
Property History
| Date | Event | Price | Change | Sq Ft Price |
|---|---|---|---|---|
| 03/11/2025 03/11/25 | For Sale | $390,000 | 0.0% | $231 / Sq Ft |
| 03/03/2025 03/03/25 | Pending | -- | -- | -- |
| 02/10/2025 02/10/25 | For Sale | $390,000 | +52.9% | $231 / Sq Ft |
| 07/08/2019 07/08/19 | Sold | $255,000 | -3.8% | $151 / Sq Ft |
| 06/06/2019 06/06/19 | Pending | -- | -- | -- |
| 05/23/2019 05/23/19 | Price Changed | $265,000 | -1.1% | $157 / Sq Ft |
| 05/16/2019 05/16/19 | Price Changed | $268,000 | -0.7% | $159 / Sq Ft |
| 05/02/2019 05/02/19 | Price Changed | $270,000 | -0.7% | $160 / Sq Ft |
| 04/25/2019 04/25/19 | Price Changed | $272,000 | -1.1% | $161 / Sq Ft |
| 04/18/2019 04/18/19 | Price Changed | $275,000 | -0.7% | $163 / Sq Ft |
| 04/04/2019 04/04/19 | Price Changed | $277,000 | -1.1% | $164 / Sq Ft |
| 03/07/2019 03/07/19 | Price Changed | $280,000 | -1.1% | $166 / Sq Ft |
| 02/21/2019 02/21/19 | Price Changed | $283,000 | -0.4% | $168 / Sq Ft |
| 02/07/2019 02/07/19 | Price Changed | $284,000 | -0.4% | $168 / Sq Ft |
| 01/24/2019 01/24/19 | Price Changed | $285,000 | -1.4% | $169 / Sq Ft |
| 01/17/2019 01/17/19 | Price Changed | $289,000 | -0.3% | $171 / Sq Ft |
| 12/27/2018 12/27/18 | Price Changed | $290,000 | -0.7% | $172 / Sq Ft |
| 12/06/2018 12/06/18 | Price Changed | $292,000 | -0.3% | $173 / Sq Ft |
| 11/08/2018 11/08/18 | Price Changed | $293,000 | -0.3% | $174 / Sq Ft |
| 10/25/2018 10/25/18 | Price Changed | $294,000 | -0.3% | $174 / Sq Ft |
| 10/04/2018 10/04/18 | Price Changed | $295,000 | -0.3% | $175 / Sq Ft |
| 09/20/2018 09/20/18 | Price Changed | $296,000 | -0.7% | $175 / Sq Ft |
| 09/13/2018 09/13/18 | Price Changed | $298,000 | -0.3% | $177 / Sq Ft |
| 08/23/2018 08/23/18 | Price Changed | $299,000 | -0.3% | $177 / Sq Ft |
| 08/02/2018 08/02/18 | Price Changed | $300,000 | -0.7% | $178 / Sq Ft |
| 07/19/2018 07/19/18 | For Sale | $302,000 | +5.6% | $179 / Sq Ft |
| 07/02/2018 07/02/18 | Sold | $286,000 | 0.0% | $170 / Sq Ft |
| 06/05/2018 06/05/18 | Price Changed | $285,900 | -1.4% | $169 / Sq Ft |
| 06/03/2018 06/03/18 | Price Changed | $289,900 | -1.7% | $172 / Sq Ft |
| 06/01/2018 06/01/18 | Price Changed | $295,000 | -1.6% | $175 / Sq Ft |
| 05/23/2018 05/23/18 | For Sale | $299,900 | -- | $178 / Sq Ft |
Source: Arizona Regional Multiple Listing Service (ARMLS)
Deed History
| Date | Type | Sale Price | Title Company |
|---|---|---|---|
| Special Warranty Deed | -- | Stewart Title | |
| Quit Claim Deed | -- | Essex Title Llc | |
| Warranty Deed | $255,000 | Os National Llc | |
| Warranty Deed | $286,000 | Opendoor West Llc | |
| Corporate Deed | $96,200 | Nations Title Insurance | |
| Trustee Deed | $101,452 | Fiesta Title & Escrow Agency | |
| Interfamily Deed Transfer | -- | -- |
Source: Public Records
Mortgage History
| Date | Status | Loan Amount | Loan Type |
|---|---|---|---|
| Previous Owner | $312,524,000 | Commercial | |
| Previous Owner | $133,250 | New Conventional | |
| Previous Owner | $145,000 | Unknown | |
| Previous Owner | $117,700 | Fannie Mae Freddie Mac | |
| Previous Owner | $97,500 | Unknown | |
| Previous Owner | $17,000 | Credit Line Revolving | |
| Previous Owner | $91,350 | New Conventional | |
| Previous Owner | $79,624 | No Value Available |
Source: Public Records
Similar Homes in the area
Source: Arizona Regional Multiple Listing Service (ARMLS)
MLS Number: 6818419
APN: 208-02-032
Disclaimer: Certain information contained herein is derived from information provided by parties other than Homes.com. All information provided is deemed reliable, but is not guaranteed to be accurate and should be independently verified.
![]() All information should be verified by the recipient and none is guaranteed as accurate by ARMLS
All information should be verified by the recipient and none is guaranteed as accurate by ARMLS
Listing Information presented by local MLS brokerage: Ten-X, local REALTOR®- Arlene Richardson - (888)-952-6393
Nearby Homes
- 18442 N 1st St
- 18051 N 1st St
- 18038 N 1st St
- 113 W Villa Rita Dr
- 143 W Michelle Dr
- 208 E Wagoner Rd
- 18221 N 2nd Place
- 18617 N 4th Dr
- 18003 N 2nd St
- 18801 N 3rd Dr
- 417 E Michigan Ave
- 604 W Villa Rita Dr
- 312 E Charleston Ave
- 18242 N 5th Place
- 2 E Muriel Dr
- 18234 N 6th St Unit 244
- 17821 N 5th St
- 810 W Villa Maria Dr
- 614 W Morrow Dr
- 102 E Angela Dr