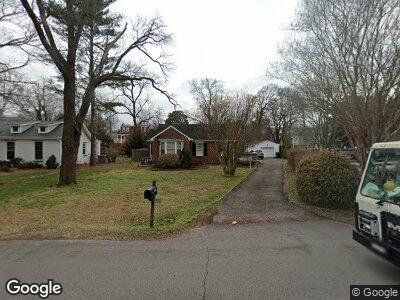
1133 Belvidere Dr Nashville, TN 37204
Estimated Value: $576,000 - $829,000
3
Beds
1
Bath
944
Sq Ft
$745/Sq Ft
Est. Value
About This Home
This home is located at 1133 Belvidere Dr, Nashville, TN 37204 and is currently estimated at $703,134, approximately $744 per square foot. 1133 Belvidere Dr is a home located in Davidson County with nearby schools including Percy Priest Elementary School, John Trotwood Moore Middle School, and Hillsboro High School.
Ownership History
Date
Name
Owned For
Owner Type
Purchase Details
Closed on
May 26, 2010
Sold by
Boulware Christopher S and Boulware Erin
Bought by
Dorris Karen
Current Estimated Value
Purchase Details
Closed on
Dec 12, 2003
Sold by
Todd Sherrie L Neely
Bought by
Boulware Christopher S and Boulware Erin
Home Financials for this Owner
Home Financials are based on the most recent Mortgage that was taken out on this home.
Original Mortgage
$142,000
Interest Rate
4.62%
Mortgage Type
Unknown
Purchase Details
Closed on
Nov 5, 1997
Sold by
Gentry Naomi Young
Bought by
Neely Sherrie L
Home Financials for this Owner
Home Financials are based on the most recent Mortgage that was taken out on this home.
Original Mortgage
$77,200
Interest Rate
7.31%
Create a Home Valuation Report for This Property
The Home Valuation Report is an in-depth analysis detailing your home's value as well as a comparison with similar homes in the area
Home Values in the Area
Average Home Value in this Area
Purchase History
| Date | Buyer | Sale Price | Title Company |
|---|---|---|---|
| Dorris Karen | $246,000 | Greenvue Title & Escrow Llc | |
| Boulware Christopher S | $177,500 | Southeast Title Of Tenn | |
| Neely Sherrie L | $96,500 | -- | |
| Neely Sherrie L | $96,500 | -- |
Source: Public Records
Mortgage History
| Date | Status | Borrower | Loan Amount |
|---|---|---|---|
| Previous Owner | Boulware Christopher S | $40,000 | |
| Previous Owner | Boulware Christopher S | $142,000 | |
| Previous Owner | Neely Sherrie L | $77,200 | |
| Closed | Boulware Christopher S | $17,750 |
Source: Public Records
Tax History Compared to Growth
Tax History
| Year | Tax Paid | Tax Assessment Tax Assessment Total Assessment is a certain percentage of the fair market value that is determined by local assessors to be the total taxable value of land and additions on the property. | Land | Improvement |
|---|---|---|---|---|
| 2024 | $3,684 | $113,200 | $72,500 | $40,700 |
| 2023 | $3,684 | $113,200 | $72,500 | $40,700 |
| 2022 | $3,684 | $113,200 | $72,500 | $40,700 |
| 2021 | $3,722 | $113,200 | $72,500 | $40,700 |
| 2020 | $3,797 | $89,950 | $57,500 | $32,450 |
| 2019 | $2,838 | $89,950 | $57,500 | $32,450 |
| 2018 | $2,825 | $89,950 | $57,500 | $32,450 |
| 2017 | $2,838 | $89,950 | $57,500 | $32,450 |
| 2016 | $3,319 | $73,500 | $47,500 | $26,000 |
| 2015 | $3,319 | $73,500 | $47,500 | $26,000 |
| 2014 | $3,319 | $73,500 | $47,500 | $26,000 |
Source: Public Records
Map
Nearby Homes
- 1131 Woodvale Dr
- 4224 Granny White Pike
- 1101 Morrow Ave
- 1600 Green Hills Dr
- 4009 Belmont Blvd
- 1601 S Observatory Dr Unit C
- 3899 Belmont Blvd
- 3901 Belmont Blvd
- 1017 Maplehurst Ave
- 3848 Granny White Pike
- 1105 Brookmeade Dr
- 4201 Belmont Blvd
- 1120 Grandview Dr
- 4100 Lealand Ln
- 1376 Duncanwood Ct
- 4018B Lealand Ln
- 1398 Grandview Dr
- 1703 Bonner Ave
- 1117 Granny White Ct
- 3612 Belmont Blvd