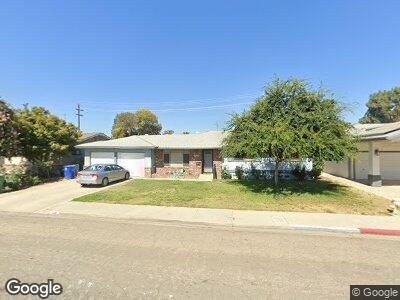
1133 N Hollywood Dr Reedley, CA 93654
Estimated Value: $329,000 - $392,000
3
Beds
2
Baths
1,590
Sq Ft
$221/Sq Ft
Est. Value
About This Home
This home is located at 1133 N Hollywood Dr, Reedley, CA 93654 and is currently estimated at $352,027, approximately $221 per square foot. 1133 N Hollywood Dr is a home located in Fresno County with nearby schools including Thomas Law Reed Elementary School, Reedley High School, and Reedley Middle College High.
Ownership History
Date
Name
Owned For
Owner Type
Purchase Details
Closed on
Jun 3, 2015
Sold by
Nikkel Lauren
Bought by
Nikkel Loren
Current Estimated Value
Home Financials for this Owner
Home Financials are based on the most recent Mortgage that was taken out on this home.
Original Mortgage
$163,775
Interest Rate
3.83%
Mortgage Type
New Conventional
Purchase Details
Closed on
Feb 13, 2013
Sold by
Messenger Kathleen Joyce
Bought by
Nikkel William K and Nikkel Adele A
Purchase Details
Closed on
Aug 17, 2012
Sold by
Nikkel William Kent
Bought by
Nikkel William K and Nikkel Adele A
Purchase Details
Closed on
Oct 14, 2004
Sold by
Nikkel Verna M
Bought by
Nikkel William Kent and Messenger Kathleen Joyce
Purchase Details
Closed on
Nov 5, 1999
Sold by
Nikkel Verna M
Bought by
Nikkel Verna M
Create a Home Valuation Report for This Property
The Home Valuation Report is an in-depth analysis detailing your home's value as well as a comparison with similar homes in the area
Home Values in the Area
Average Home Value in this Area
Purchase History
| Date | Buyer | Sale Price | Title Company |
|---|---|---|---|
| Nikkel Loren | -- | Chicago Title Company | |
| Nikkel Loren | $160,500 | Chicago Title Company | |
| Nikkel William K | -- | None Available | |
| Nikkel William K | -- | None Available | |
| Nikkel William Kent | -- | -- | |
| Nikkel Verna M | -- | -- | |
| Nikkel Verna M | -- | -- |
Source: Public Records
Mortgage History
| Date | Status | Borrower | Loan Amount |
|---|---|---|---|
| Open | Nikkel Loren | $184,800 | |
| Closed | Loren Nikkel | $180,000 | |
| Closed | Nikkel Loren | $163,775 |
Source: Public Records
Tax History Compared to Growth
Tax History
| Year | Tax Paid | Tax Assessment Tax Assessment Total Assessment is a certain percentage of the fair market value that is determined by local assessors to be the total taxable value of land and additions on the property. | Land | Improvement |
|---|---|---|---|---|
| 2023 | $2,153 | $182,046 | $45,510 | $136,536 |
| 2022 | $2,157 | $178,477 | $44,618 | $133,859 |
| 2021 | $2,111 | $174,979 | $43,744 | $131,235 |
| 2020 | $2,129 | $173,186 | $43,296 | $129,890 |
| 2019 | $2,071 | $169,792 | $42,448 | $127,344 |
| 2018 | $2,067 | $166,464 | $41,616 | $124,848 |
| 2017 | $1,970 | $163,200 | $40,800 | $122,400 |
| 2016 | $2,003 | $160,000 | $40,000 | $120,000 |
| 2015 | $1,301 | $105,906 | $26,643 | $79,263 |
| 2014 | $1,303 | $103,833 | $26,122 | $77,711 |
Source: Public Records
Map
Nearby Homes
- 1239 N Hollywood Dr
- 607 W Sycamore Ct
- 761 W Palm Ave
- 729 N Acacia Ave
- 657 W Parlier Ave Unit 114
- 657 W Parlier Ave Unit 130
- 657 W Parlier Ave Unit 106
- 549 N Acacia Ave
- 558 N Acacia Ave
- 333 E Linden Ave
- 376 E Carob Ave
- 263 E Aspen Dr
- 180 W Cambridge Dr
- 1864 N Del Altair Ave
- 1070 W Friesen Ave
- 558 N Steven Ave
- 1334 N Magnolia Ave
- 2165 N Sunny Ln
- 1331 E St
- 1873 E August Ave