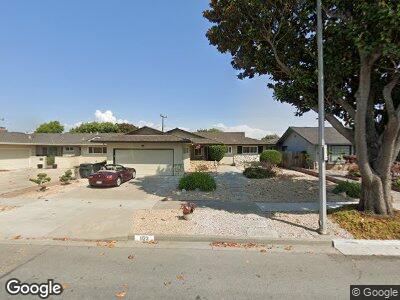
1133 San Diego Dr Salinas, CA 93901
South Salinas NeighborhoodEstimated Value: $801,960 - $946,000
3
Beds
2
Baths
1,885
Sq Ft
$453/Sq Ft
Est. Value
About This Home
This home is located at 1133 San Diego Dr, Salinas, CA 93901 and is currently estimated at $852,990, approximately $452 per square foot. 1133 San Diego Dr is a home located in Monterey County with nearby schools including Monterey Park Elementary School, Lincoln Elementary School, and Mission Park Elementary School.
Ownership History
Date
Name
Owned For
Owner Type
Purchase Details
Closed on
Sep 24, 2021
Sold by
Klepar George E and Klepar Margot C
Bought by
Klepar George E and Klepar Margot C
Current Estimated Value
Create a Home Valuation Report for This Property
The Home Valuation Report is an in-depth analysis detailing your home's value as well as a comparison with similar homes in the area
Home Values in the Area
Average Home Value in this Area
Purchase History
| Date | Buyer | Sale Price | Title Company |
|---|---|---|---|
| Klepar George E | -- | None Available |
Source: Public Records
Mortgage History
| Date | Status | Borrower | Loan Amount |
|---|---|---|---|
| Previous Owner | Klepar George E | $252,000 | |
| Previous Owner | Klepar George E | $460,000 | |
| Previous Owner | Klepar George E | $31,000 | |
| Previous Owner | Klepar George E | $160,356 | |
| Previous Owner | Klepar George E | $24,551 | |
| Previous Owner | Klepar George E | $42,100 |
Source: Public Records
Tax History Compared to Growth
Tax History
| Year | Tax Paid | Tax Assessment Tax Assessment Total Assessment is a certain percentage of the fair market value that is determined by local assessors to be the total taxable value of land and additions on the property. | Land | Improvement |
|---|---|---|---|---|
| 2024 | $3,473 | $302,586 | $87,841 | $214,745 |
| 2023 | $3,354 | $296,654 | $86,119 | $210,535 |
| 2022 | $3,227 | $290,838 | $84,431 | $206,407 |
| 2021 | $3,099 | $285,136 | $82,776 | $202,360 |
| 2020 | $3,012 | $282,214 | $81,928 | $200,286 |
| 2019 | $2,989 | $276,681 | $80,322 | $196,359 |
| 2018 | $2,949 | $271,257 | $78,748 | $192,509 |
| 2017 | $2,950 | $265,939 | $77,204 | $188,735 |
| 2016 | $2,951 | $260,726 | $75,691 | $185,035 |
| 2015 | $2,975 | $256,811 | $74,555 | $182,256 |
| 2014 | $2,775 | $251,781 | $73,095 | $178,686 |
Source: Public Records
Map
Nearby Homes
- 676 & 678 Ambrose Dr
- 230 Martella St
- 607 La Mesa Dr
- 932 Grove St
- 536 Alameda Ave
- 210 E Romie Ln
- 23 Grove St
- 219 E Acacia St
- 718 Meadow Dr
- 35 Willow St
- 75 S Madeira Ave
- 1067 Padre Dr Unit 1
- 442 Soledad St
- 416 Front St
- 16 Del Rey Cir
- 1061 Riker St Unit 1
- 1057 Riker St Unit 4
- 527 Capitol St
- 191 Chaucer Dr
- 21 N Filice St