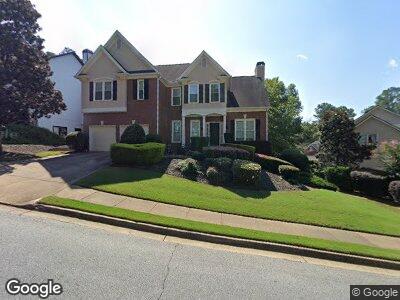
1135 Compass Pointe Crossing Alpharetta, GA 30005
Windward NeighborhoodEstimated Value: $648,000 - $736,000
4
Beds
3
Baths
2,244
Sq Ft
$303/Sq Ft
Est. Value
About This Home
This home is located at 1135 Compass Pointe Crossing, Alpharetta, GA 30005 and is currently estimated at $679,834, approximately $302 per square foot. 1135 Compass Pointe Crossing is a home located in Fulton County with nearby schools including Creek View Elementary School, Webb Bridge Middle School, and Alpharetta High School.
Ownership History
Date
Name
Owned For
Owner Type
Purchase Details
Closed on
Dec 8, 2016
Sold by
Alferez Nathaly
Bought by
Haddad Paul
Current Estimated Value
Purchase Details
Closed on
Aug 28, 1999
Sold by
Magin Patrick J and Magin Susan E
Bought by
Haddad Paul
Home Financials for this Owner
Home Financials are based on the most recent Mortgage that was taken out on this home.
Original Mortgage
$232,750
Interest Rate
5.88%
Mortgage Type
New Conventional
Purchase Details
Closed on
Sep 11, 1998
Sold by
Pearson Pamela A
Bought by
Magin Patrick J and Magin Susan
Home Financials for this Owner
Home Financials are based on the most recent Mortgage that was taken out on this home.
Original Mortgage
$195,300
Interest Rate
6.95%
Mortgage Type
New Conventional
Create a Home Valuation Report for This Property
The Home Valuation Report is an in-depth analysis detailing your home's value as well as a comparison with similar homes in the area
Home Values in the Area
Average Home Value in this Area
Purchase History
| Date | Buyer | Sale Price | Title Company |
|---|---|---|---|
| Haddad Paul | $306,700 | -- | |
| Haddad Paul | $245,000 | -- | |
| Magin Patrick J | $217,000 | -- |
Source: Public Records
Mortgage History
| Date | Status | Borrower | Loan Amount |
|---|---|---|---|
| Previous Owner | Haddad Paul | $228,750 | |
| Previous Owner | Haddad Paul | $220,500 | |
| Previous Owner | Haddad Paul | $220,500 | |
| Previous Owner | Haddad Paul | $220,500 | |
| Previous Owner | Haddad Paul | $23,000 | |
| Previous Owner | Haddad Paul | $232,750 | |
| Previous Owner | Magin Patrick J | $195,300 |
Source: Public Records
Tax History Compared to Growth
Tax History
| Year | Tax Paid | Tax Assessment Tax Assessment Total Assessment is a certain percentage of the fair market value that is determined by local assessors to be the total taxable value of land and additions on the property. | Land | Improvement |
|---|---|---|---|---|
| 2023 | $5,666 | $200,720 | $36,160 | $164,560 |
| 2022 | $3,301 | $200,720 | $36,160 | $164,560 |
| 2021 | $3,841 | $159,200 | $33,480 | $125,720 |
| 2020 | $3,863 | $157,320 | $33,120 | $124,200 |
| 2019 | $567 | $154,520 | $32,520 | $122,000 |
| 2018 | $3,875 | $162,200 | $33,520 | $128,680 |
| 2017 | $3,231 | $122,680 | $24,160 | $98,520 |
| 2016 | $3,228 | $122,680 | $24,160 | $98,520 |
| 2015 | $3,746 | $122,680 | $24,160 | $98,520 |
| 2014 | $2,996 | $110,480 | $21,760 | $88,720 |
Source: Public Records
Map
Nearby Homes
- 7115 Harbour Landing
- 415 Prestwick Ct
- 425 Prestwick Ct
- 6130 Harbour Overlook
- 1050 Signal Pointe
- 201 Hunley Ct
- 1010 Lake Shore Overlook
- 290 Ardsley Ln
- 1125 Lake Shore Overlook
- 2195 Lake Shore Landing
- 10 Club Ct
- 7340 Jamestown Dr
- 1160 Lake Shore Overlook
- 7730 Pierpoint Ln
- 1090 Bay Pointe Crossing
- 7920 Willoughby Ct
- 1100 Muirfield Ct
- 1215 Wynridge Crossing