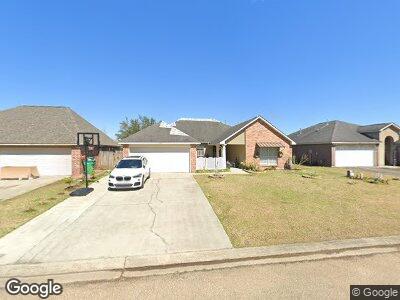
11383 Buckingham Ave Denham Springs, LA 70726
Estimated Value: $232,000 - $262,000
4
Beds
2
Baths
1,981
Sq Ft
$124/Sq Ft
Est. Value
About This Home
This home is located at 11383 Buckingham Ave, Denham Springs, LA 70726 and is currently estimated at $245,360, approximately $123 per square foot. 11383 Buckingham Ave is a home located in Livingston Parish with nearby schools including Juban Parc Elementary School, Juban Parc Junior High School, and Denham Springs Freshman High School.
Ownership History
Date
Name
Owned For
Owner Type
Purchase Details
Closed on
Feb 1, 2010
Sold by
Crescent Properties Inc
Bought by
Buxton David and Buxton David Lane
Current Estimated Value
Home Financials for this Owner
Home Financials are based on the most recent Mortgage that was taken out on this home.
Original Mortgage
$173,469
Outstanding Balance
$117,780
Interest Rate
5.16%
Mortgage Type
New Conventional
Estimated Equity
$127,580
Purchase Details
Closed on
Jun 13, 2007
Sold by
D R Horton Inc Gulf Coast
Bought by
4 S Co 2
Purchase Details
Closed on
Sep 26, 2006
Sold by
D R Horton Inc Gulf Coast
Bought by
Scott Michael Timothy and Norris Jalanie
Home Financials for this Owner
Home Financials are based on the most recent Mortgage that was taken out on this home.
Original Mortgage
$165,600
Interest Rate
9.28%
Mortgage Type
Adjustable Rate Mortgage/ARM
Create a Home Valuation Report for This Property
The Home Valuation Report is an in-depth analysis detailing your home's value as well as a comparison with similar homes in the area
Home Values in the Area
Average Home Value in this Area
Purchase History
| Date | Buyer | Sale Price | Title Company |
|---|---|---|---|
| Buxton David | $168,500 | Champlin Title Inc | |
| 4 S Co 2 | $417 | None Available | |
| Scott Michael Timothy | $165,600 | Dhi Title Company |
Source: Public Records
Mortgage History
| Date | Status | Borrower | Loan Amount |
|---|---|---|---|
| Open | Buxton David | $173,469 | |
| Previous Owner | Scott Michael Timothy | $165,600 |
Source: Public Records
Tax History Compared to Growth
Tax History
| Year | Tax Paid | Tax Assessment Tax Assessment Total Assessment is a certain percentage of the fair market value that is determined by local assessors to be the total taxable value of land and additions on the property. | Land | Improvement |
|---|---|---|---|---|
| 2024 | $1,948 | $18,532 | $2,180 | $16,352 |
| 2023 | $2,080 | $17,120 | $2,180 | $14,940 |
| 2022 | $2,094 | $17,120 | $2,180 | $14,940 |
| 2021 | $1,844 | $17,120 | $2,180 | $14,940 |
| 2020 | $1,834 | $17,120 | $2,180 | $14,940 |
| 2019 | $1,956 | $17,790 | $2,180 | $15,610 |
| 2018 | $1,974 | $17,790 | $2,180 | $15,610 |
| 2017 | $2,018 | $17,790 | $2,180 | $15,610 |
| 2015 | $1,051 | $16,410 | $2,180 | $14,230 |
| 2014 | $1,067 | $16,410 | $2,180 | $14,230 |
Source: Public Records
Map
Nearby Homes
- 26017 Big Ben Dr
- 26030 Big Ben Dr
- 11407 Lemonwood Dr
- 11406 Meadow View Dr
- 26093 Purdy Ave
- 26099 Purdy Ave
- 26078 Purdy Ave
- 11533 Densmore Dr
- 26130 Willette Ave
- 26142 Willette Ave
- 26159 Willette Ave
- 26090 Purdy Ave
- 11456 Densmore Dr
- 11521 Densmore Dr
- 11509 Densmore Dr
- 11503 Densmore Dr
- 12182 Brush Creek St
- 26426 Avoyelles Ave
- 26411 Evangeline Trace Blvd
- 12220 Buddy Ellis Rd