1146 9th St Manhattan Beach, CA 90266
Estimated Value: $2,578,000 - $5,165,000
5
Beds
4
Baths
4,360
Sq Ft
$927/Sq Ft
Est. Value
About This Home
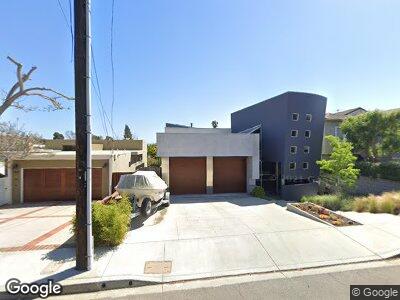
This home is located at 1146 9th St, Manhattan Beach, CA 90266 and is currently estimated at $4,042,377, approximately $927 per square foot. 1146 9th St is a home located in Los Angeles County with nearby schools including Aurelia Pennekamp Elementary School, Manhattan Beach Middle School, and Mira Costa High School.
Ownership History
Date
Name
Owned For
Owner Type
Purchase Details
Closed on
Mar 25, 2016
Sold by
Yamada Chris
Bought by
The Yamada Family Trust
Current Estimated Value
Purchase Details
Closed on
Mar 31, 2003
Sold by
Yamada Chris and Yamada Marlene
Bought by
Yamada Chris
Purchase Details
Closed on
Mar 27, 2000
Sold by
Rodda Robin
Bought by
Yamada Chris L
Home Financials for this Owner
Home Financials are based on the most recent Mortgage that was taken out on this home.
Original Mortgage
$768,750
Interest Rate
7.83%
Purchase Details
Closed on
Mar 22, 1996
Sold by
Rodda Jo Ann
Bought by
Rodda Tom E
Home Financials for this Owner
Home Financials are based on the most recent Mortgage that was taken out on this home.
Original Mortgage
$200,000
Interest Rate
7.84%
Create a Home Valuation Report for This Property
The Home Valuation Report is an in-depth analysis detailing your home's value as well as a comparison with similar homes in the area
Home Values in the Area
Average Home Value in this Area
Purchase History
| Date | Buyer | Sale Price | Title Company |
|---|---|---|---|
| The Yamada Family Trust | -- | None Available | |
| Yamada Chris | -- | -- | |
| Yamada Chris L | $1,025,000 | Commonwealth Title | |
| Rodda Tom E | -- | Southland Title Corporation |
Source: Public Records
Mortgage History
| Date | Status | Borrower | Loan Amount |
|---|---|---|---|
| Open | Yamada Chris | $417,000 | |
| Closed | Yamada Chris | $175,000 | |
| Closed | Yamada Chris L | $550,000 | |
| Open | Yamada Chris L | $811,050 | |
| Closed | Yamada Chris L | $768,750 | |
| Previous Owner | Rodda Tom E | $200,000 |
Source: Public Records
Tax History Compared to Growth
Tax History
| Year | Tax Paid | Tax Assessment Tax Assessment Total Assessment is a certain percentage of the fair market value that is determined by local assessors to be the total taxable value of land and additions on the property. | Land | Improvement |
|---|---|---|---|---|
| 2024 | $19,221 | $1,626,765 | $772,254 | $854,511 |
| 2023 | $18,594 | $1,594,868 | $757,112 | $837,756 |
| 2022 | $18,278 | $1,563,597 | $742,267 | $821,330 |
| 2021 | $17,960 | $1,532,939 | $727,713 | $805,226 |
| 2019 | $17,485 | $1,487,474 | $706,130 | $781,344 |
| 2018 | $17,065 | $1,458,309 | $692,285 | $766,024 |
| 2016 | $15,786 | $1,401,682 | $665,403 | $736,279 |
| 2015 | $15,462 | $1,380,629 | $655,409 | $725,220 |
| 2014 | $15,252 | $1,353,585 | $642,571 | $711,014 |
Source: Public Records
Map
Nearby Homes