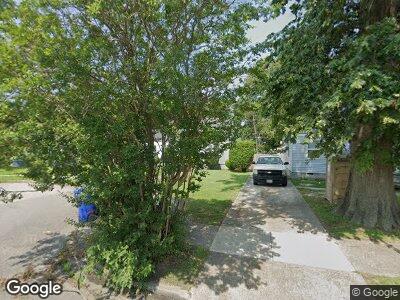
1148 Orcutt Ave Newport News, VA 23607
Christopher Shores NeighborhoodEstimated Value: $158,000 - $173,000
2
Beds
1
Bath
763
Sq Ft
$213/Sq Ft
Est. Value
About This Home
This home is located at 1148 Orcutt Ave, Newport News, VA 23607 and is currently estimated at $162,370, approximately $212 per square foot. 1148 Orcutt Ave is a home located in Newport News City with nearby schools including Richard T. Yates Elementary School, Huntington Middle School, and Menchville High School.
Ownership History
Date
Name
Owned For
Owner Type
Purchase Details
Closed on
Jul 14, 2021
Sold by
Shawar Iyad
Bought by
Shawar Nihad
Current Estimated Value
Home Financials for this Owner
Home Financials are based on the most recent Mortgage that was taken out on this home.
Original Mortgage
$103,785
Outstanding Balance
$95,623
Interest Rate
2.93%
Mortgage Type
FHA
Estimated Equity
$66,747
Purchase Details
Closed on
Aug 19, 2019
Sold by
Equity Trustees Llc
Bought by
Shawar Iyad
Create a Home Valuation Report for This Property
The Home Valuation Report is an in-depth analysis detailing your home's value as well as a comparison with similar homes in the area
Home Values in the Area
Average Home Value in this Area
Purchase History
| Date | Buyer | Sale Price | Title Company |
|---|---|---|---|
| Shawar Nihad | $120,000 | Stewart Title Guaranty Co | |
| Shawar Iyad | $36,000 | None Available |
Source: Public Records
Mortgage History
| Date | Status | Borrower | Loan Amount |
|---|---|---|---|
| Open | Shawar Nihad | $103,785 | |
| Previous Owner | Shawar Iyad | $60,000 | |
| Previous Owner | Stalling Iva C | $50,000 |
Source: Public Records
Tax History Compared to Growth
Tax History
| Year | Tax Paid | Tax Assessment Tax Assessment Total Assessment is a certain percentage of the fair market value that is determined by local assessors to be the total taxable value of land and additions on the property. | Land | Improvement |
|---|---|---|---|---|
| 2024 | $1,879 | $159,200 | $49,200 | $110,000 |
| 2023 | $1,784 | $138,700 | $33,900 | $104,800 |
| 2022 | $1,697 | $129,200 | $30,800 | $98,400 |
| 2021 | $1,479 | $109,200 | $28,000 | $81,200 |
| 2020 | $1,396 | $102,400 | $28,000 | $74,400 |
| 2019 | $1,169 | $84,200 | $28,000 | $56,200 |
| 2018 | $1,166 | $84,200 | $28,000 | $56,200 |
| 2017 | $1,166 | $84,200 | $28,000 | $56,200 |
| 2016 | $1,162 | $84,200 | $28,000 | $56,200 |
| 2015 | $1,194 | $87,300 | $31,100 | $56,200 |
| 2014 | $1,058 | $92,400 | $34,500 | $57,900 |
Source: Public Records
Map
Nearby Homes