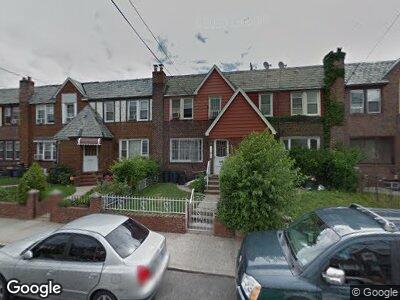
115-45 204th St Saint Albans, NY 11412
Saint Albans NeighborhoodEstimated Value: $546,000 - $728,000
3
Beds
2
Baths
1,800
Sq Ft
$353/Sq Ft
Est. Value
About This Home
This home is located at 115-45 204th St, Saint Albans, NY 11412 and is currently estimated at $635,771, approximately $353 per square foot. 115-45 204th St is a home located in Queens County with nearby schools including P.S. 136 Roy Wilkins, I.S. 192 The Linden, and St Albans Christian Academy.
Ownership History
Date
Name
Owned For
Owner Type
Purchase Details
Closed on
Jan 8, 2024
Sold by
204 Crystal Development Llc
Bought by
Scarlett Deroll
Current Estimated Value
Home Financials for this Owner
Home Financials are based on the most recent Mortgage that was taken out on this home.
Original Mortgage
$666,971
Outstanding Balance
$659,652
Interest Rate
7.03%
Mortgage Type
Purchase Money Mortgage
Estimated Equity
-$1,441
Purchase Details
Closed on
Jun 30, 2023
Sold by
Kq Development Llc
Bought by
204 Crystal Development Llc
Home Financials for this Owner
Home Financials are based on the most recent Mortgage that was taken out on this home.
Original Mortgage
$326,250
Interest Rate
6.79%
Mortgage Type
Purchase Money Mortgage
Purchase Details
Closed on
Mar 3, 2023
Sold by
Laspina Gregory M Esq
Bought by
Kq Development Llc
Home Financials for this Owner
Home Financials are based on the most recent Mortgage that was taken out on this home.
Original Mortgage
$322,000
Interest Rate
6.09%
Mortgage Type
Purchase Money Mortgage
Create a Home Valuation Report for This Property
The Home Valuation Report is an in-depth analysis detailing your home's value as well as a comparison with similar homes in the area
Home Values in the Area
Average Home Value in this Area
Purchase History
| Date | Buyer | Sale Price | Title Company |
|---|---|---|---|
| Scarlett Deroll | $690,000 | -- | |
| Scarlett Deroll | $690,000 | -- | |
| 204 Crystal Development Llc | $458,000 | -- | |
| 204 Crystal Development Llc | $458,000 | -- | |
| Kq Development Llc | $358,000 | -- | |
| Kq Development Llc | $358,000 | -- |
Source: Public Records
Mortgage History
| Date | Status | Borrower | Loan Amount |
|---|---|---|---|
| Open | Scarlett Deroll | $666,971 | |
| Closed | Scarlett Deroll | $666,971 | |
| Previous Owner | 204 Crystal Development Llc | $326,250 | |
| Previous Owner | Kq Development Llc | $322,000 | |
| Previous Owner | Black Gloria L | $60,000 | |
| Previous Owner | Black Gloria L | $175,000 | |
| Previous Owner | Black Gloria L | $53,000 |
Source: Public Records
Tax History Compared to Growth
Tax History
| Year | Tax Paid | Tax Assessment Tax Assessment Total Assessment is a certain percentage of the fair market value that is determined by local assessors to be the total taxable value of land and additions on the property. | Land | Improvement |
|---|---|---|---|---|
| 2024 | $5,167 | $25,724 | $8,272 | $17,452 |
| 2023 | $4,874 | $24,269 | $6,718 | $17,551 |
| 2022 | $3,912 | $31,260 | $10,380 | $20,880 |
| 2021 | $4,159 | $30,540 | $10,380 | $20,160 |
| 2020 | $4,151 | $29,280 | $10,380 | $18,900 |
| 2019 | $3,825 | $29,220 | $10,380 | $18,840 |
| 2018 | $920 | $20,224 | $7,845 | $12,379 |
| 2017 | $2,187 | $19,080 | $9,853 | $9,227 |
| 2016 | $2,144 | $19,080 | $9,853 | $9,227 |
| 2015 | $1,220 | $18,936 | $10,853 | $8,083 |
| 2014 | $1,220 | $17,865 | $10,959 | $6,906 |
Source: Public Records
Map
Nearby Homes
- 205-15 116th Ave
- 116-03 205th St
- 115-12 203rd St
- 205-26 116th Rd
- 114-41 203rd St
- 116-40 203rd St
- 201-08 116th Ave
- 116-23 201st St
- 114-62 201st St
- 114-45 207th St
- 117-28 202nd St
- 11422 201st St
- 114-16 207th St
- 118-09 203rd St
- 114-40 200th St
- 115-46 199th St
- 11420 208th St
- 118-29 205th St
- 11812 Francis Lewis Blvd
- 113-21 203rd St