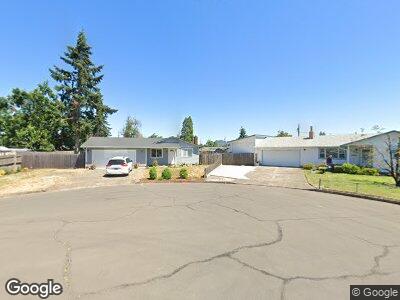
1181 S 39th St Springfield, OR 97478
East Springfield NeighborhoodEstimated Value: $363,796 - $382,000
3
Beds
1
Bath
1,008
Sq Ft
$370/Sq Ft
Est. Value
About This Home
This home is located at 1181 S 39th St, Springfield, OR 97478 and is currently estimated at $373,449, approximately $370 per square foot. 1181 S 39th St is a home located in Lane County with nearby schools including Douglas Gardens Elementary School, Agnes Stewart Middle School, and Springfield High School.
Ownership History
Date
Name
Owned For
Owner Type
Purchase Details
Closed on
Mar 11, 2015
Sold by
Pachl Magdalene
Bought by
Sanford Joshua D and Gaul Sanford Jessica D
Current Estimated Value
Home Financials for this Owner
Home Financials are based on the most recent Mortgage that was taken out on this home.
Original Mortgage
$142,200
Outstanding Balance
$111,470
Interest Rate
3.61%
Mortgage Type
New Conventional
Estimated Equity
$263,842
Purchase Details
Closed on
Oct 27, 1998
Sold by
Leber Robert E and Leber Shirley L
Bought by
Pachl Albert F and Pachl Magdalene
Home Financials for this Owner
Home Financials are based on the most recent Mortgage that was taken out on this home.
Original Mortgage
$115,400
Interest Rate
6.6%
Create a Home Valuation Report for This Property
The Home Valuation Report is an in-depth analysis detailing your home's value as well as a comparison with similar homes in the area
Home Values in the Area
Average Home Value in this Area
Purchase History
| Date | Buyer | Sale Price | Title Company |
|---|---|---|---|
| Sanford Joshua D | $158,000 | First American Title | |
| Pachl Albert F | $119,500 | Fidelity National Title Ins |
Source: Public Records
Mortgage History
| Date | Status | Borrower | Loan Amount |
|---|---|---|---|
| Open | Sanford Joshua D | $142,200 | |
| Previous Owner | Pachl Albert F | $20,000 | |
| Previous Owner | Pachl Albert F | $115,400 |
Source: Public Records
Tax History Compared to Growth
Tax History
| Year | Tax Paid | Tax Assessment Tax Assessment Total Assessment is a certain percentage of the fair market value that is determined by local assessors to be the total taxable value of land and additions on the property. | Land | Improvement |
|---|---|---|---|---|
| 2023 | $1,948 | $160,454 | $0 | $0 |
| 2022 | $1,855 | $155,781 | $0 | $0 |
| 2021 | $1,810 | $151,244 | $0 | $0 |
| 2020 | $1,754 | $146,839 | $0 | $0 |
| 2019 | $1,686 | $142,563 | $0 | $0 |
| 2018 | $1,631 | $134,380 | $0 | $0 |
| 2017 | $1,572 | $134,380 | $0 | $0 |
| 2016 | $1,530 | $130,466 | $0 | $0 |
| 2015 | $1,489 | $126,666 | $0 | $0 |
| 2014 | $1,443 | $122,977 | $0 | $0 |
Source: Public Records
Map
Nearby Homes
- 3883 Osage St
- 0 Osage St
- 1060 Dondea St
- 838 Hazelnut Ln
- 3760 Cherokee Dr
- 4018 Forsythia St
- 4072 Forsythia St
- 4353 Kalmia St
- 4356 Kalmia St
- 4369 Kalmia St
- 4128 Forsythia St
- 4109 Virginia Ave
- 3720 Virginia Ave
- 4252 Forsythia St
- 3421 Virginia Ave
- 1372 Clearwater Ln
- 3211 S E Ct
- 249 S 41st Place
- 1164 S 43rd Place
- 3597 S A St