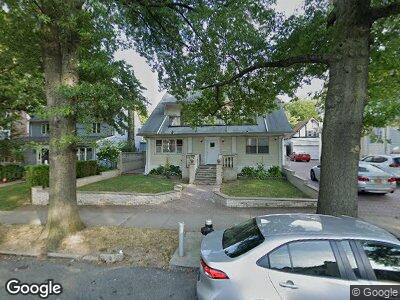
119-36 80th Rd Kew Gardens, NY 11415
Kew Gardens NeighborhoodEstimated Value: $1,287,000 - $1,740,000
1
Bed
1
Bath
4,860
Sq Ft
$311/Sq Ft
Est. Value
About This Home
This home is located at 119-36 80th Rd, Kew Gardens, NY 11415 and is currently estimated at $1,513,500, approximately $311 per square foot. 119-36 80th Rd is a home located in Queens County with nearby schools including P.S. 99 - Kew Gardens, J.H.S. 190 Russell Sage, and Hillcrest High School.
Create a Home Valuation Report for This Property
The Home Valuation Report is an in-depth analysis detailing your home's value as well as a comparison with similar homes in the area
Home Values in the Area
Average Home Value in this Area
Mortgage History
| Date | Status | Borrower | Loan Amount |
|---|---|---|---|
| Previous Owner | Rabaev Ella | $200,000 |
Source: Public Records
Tax History Compared to Growth
Tax History
| Year | Tax Paid | Tax Assessment Tax Assessment Total Assessment is a certain percentage of the fair market value that is determined by local assessors to be the total taxable value of land and additions on the property. | Land | Improvement |
|---|---|---|---|---|
| 2024 | $12,578 | $62,623 | $18,781 | $43,842 |
| 2023 | $11,866 | $59,080 | $15,936 | $43,144 |
| 2022 | $11,127 | $115,260 | $37,320 | $77,940 |
| 2021 | $11,709 | $121,020 | $37,320 | $83,700 |
| 2020 | $11,640 | $104,100 | $37,320 | $66,780 |
| 2019 | $10,917 | $105,480 | $37,320 | $68,160 |
| 2018 | $10,036 | $49,233 | $14,894 | $34,339 |
| 2017 | $9,468 | $46,448 | $15,979 | $30,469 |
| 2016 | $9,269 | $46,448 | $15,979 | $30,469 |
| 2015 | $5,285 | $45,825 | $23,631 | $22,194 |
| 2014 | $5,285 | $43,489 | $24,234 | $19,255 |
Source: Public Records
Map
Nearby Homes
- 119-49 Union Turnpike Unit 9A
- 119-49 Union Turnpike Unit 7E
- 45 Kew Gardens Rd Unit 6D
- 118-18 Union Turnpike E Unit 16A
- 118-18 Union Turnpike E Unit 9B
- 118-18 Union Turnpike E Unit 5K
- 118-18 Union Turnpike E Unit 3H
- 118-18 Union Turnpike E Unit 6E
- 118-18 Union Turnpike E Unit 21H
- 118-18 Union Turnpike E Unit 7-D
- 118-18 Union Turnpike E Unit 4E
- 118-18 Union Turnpike E Unit 10-C
- 78-14 Austin St Unit 1
- 78-14 Austin St Unit 4G
- 123-25 82nd Ave Unit 5T
- 7829 Austin St Unit 410
- 7829 Austin St Unit 314
- 7829 Austin St Unit 313
- 7829 Austin St Unit 419
- 7829 Austin St Unit 512