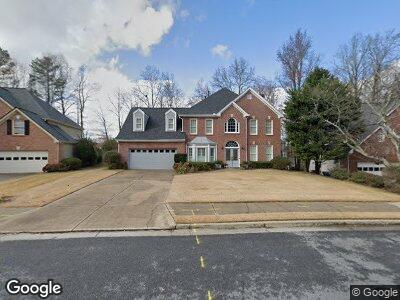
11905 Leeward Walk Cir Alpharetta, GA 30005
Estimated Value: $648,000 - $735,000
3
Beds
3
Baths
3,427
Sq Ft
$200/Sq Ft
Est. Value
About This Home
This home is located at 11905 Leeward Walk Cir, Alpharetta, GA 30005 and is currently estimated at $684,316, approximately $199 per square foot. 11905 Leeward Walk Cir is a home located in Fulton County with nearby schools including Lake Windward Elementary School, Taylor Road Middle School, and Chattahoochee High School.
Create a Home Valuation Report for This Property
The Home Valuation Report is an in-depth analysis detailing your home's value as well as a comparison with similar homes in the area
Home Values in the Area
Average Home Value in this Area
Mortgage History
| Date | Status | Borrower | Loan Amount |
|---|---|---|---|
| Closed | Foresman Steven J | $100,000 | |
| Closed | Foresman Steven J | $197,300 | |
| Closed | Foresman Steven J | $207,600 |
Source: Public Records
Tax History Compared to Growth
Tax History
| Year | Tax Paid | Tax Assessment Tax Assessment Total Assessment is a certain percentage of the fair market value that is determined by local assessors to be the total taxable value of land and additions on the property. | Land | Improvement |
|---|---|---|---|---|
| 2023 | $7,150 | $253,320 | $56,000 | $197,320 |
| 2022 | $3,058 | $205,600 | $40,880 | $164,720 |
| 2021 | $3,559 | $157,960 | $32,400 | $125,560 |
| 2020 | $3,575 | $157,640 | $29,600 | $128,040 |
| 2019 | $531 | $145,880 | $25,440 | $120,440 |
| 2018 | $3,563 | $142,480 | $24,840 | $117,640 |
| 2017 | $3,066 | $117,040 | $20,720 | $96,320 |
| 2016 | $3,072 | $119,400 | $20,720 | $98,680 |
| 2015 | $3,443 | $114,240 | $20,720 | $93,520 |
| 2014 | $2,618 | $98,160 | $17,800 | $80,360 |
Source: Public Records
Map
Nearby Homes
- 545 Creek Landing Ln
- 12350 Broadleaf Ln
- 12270 Leeward Walk Cir
- 5260 Cresslyn Ridge
- 11894 Aspen Forest Dr
- 940 Magnolia Blossom Ct Unit 4D
- 935 Magnolia Blossom Ct
- 5145 Southlake Dr
- 5485 Woodrun Ln Unit 1
- 400 Overhill Bend
- 280 Leaf Ct
- 715 Newport Hollow
- 5198 Wellsley Bend
- 11780 Wellsley Way
- 13015 Fox Rd
- 840 Stonehaven Ln
- 110 Compton Hall Dr
- 320 Woodlake Ct