$323,209 - $454,000
RENTED JUN 11, 2024
4 Beds
2 Baths
1,248 Sq Ft
$313 Price per Sq Ft

About This Home

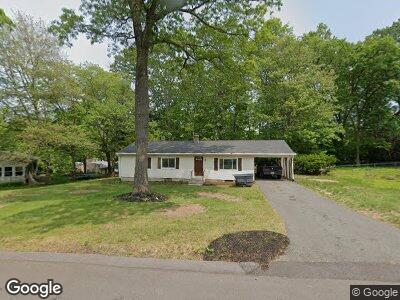
This home is located at 12 Linwood Dr, Wilbraham, MA 01095 and is currently estimated at $390,552, approximately $312 per square foot. 12 Linwood Dr is a home located in Hampden County with nearby schools including Minnechaug Regional High School, St. John the Baptist School, and Wilbraham & Monson Academy.

Ownership History

Date Name Owned For Owner Type

Purchase Details

Closed on
Nov 4, 2015
Sold by
Posley William C
Bought by
Posley Donna C
Current Estimated Value
$390,552

Purchase Details

Closed on
Dec 31, 2008
Sold by
Posley William C
Bought by
Posley Donna C and Posley William C

Range of Values:

Collateral Analytics

Collateral Analytics Collateral Analytics AVMs (Automated Valuation Model) employ a number of statistical approaches combined with neighborhood-specific comparable selection guarantees the most up-to-date and precise valuations.

Not Available

Collateral Analytics does not have data for the current month. Please view the chart for historical values.

ICE

ICE Mortgage Technology ICE Mortgage Technology’s AVM (Automated Valuation Model) is a state-of-the-art online residential property valuation tool that provides a quick and accurate estimate of the value of almost any home in the U.S.

Not Available

ICE Mortgage Technology does not have data for the current month. Please view the chart for historical values.

First American

First American First American Data & Analytics’ next-generation AVM combines unrivaled data assets with a blended ensemble of valuation models to produce highly accurate, reliable valuations you can trust.

Not Available

First American does not have data for the current month. Please view the chart for historical values.

Quantarium

Quantarium Quantarium’s valuation service, repeatedly proven the industry’s most accurate and comprehensive, is supercharged with a self-learning and auto-tuning AI engine that continually becomes smarter and more accurate as it processes daily inputs from the industry’s leading RE data lake.

Not Available

Quantarium does not have data for the current month. Please view the chart for historical values.

Average Value
Not Available
List Price
Sold Price
Create a Home Valuation Report for This Property
The Home Valuation Report is an in-depth analysis detailing your home's value as well as a comparison with similar homes in the area

Home Values in the Area

Source: Public Records

Average Home Value in this Area


Source: Public Records

Purchase History

Date Buyer Sale Price Title Company
Posley Donna C -- --
Source: Public Records

Mortgage History

Date Status Borrower Loan Amount
Open Posley William C $192,000
Source: Public Records

Property History

Date Event Price Change Sq Ft Price
06/11/2024 06/11/24 Rented $2,850 -5.0% --
06/11/2024 06/11/24 Under Contract -- -- --
02/26/2024 02/26/24 For Rent $3,000 -- --

Tax History Compared to Growth

Source: Public Records

Tax History

Year Tax Paid Tax Assessment Tax Assessment Total Assessment is a certain percentage of the fair market value that is determined by local assessors to be the total taxable value of land and additions on the property. Land Improvement
2025 $5,303 $296,600 $86,600 $210,000
2024 $5,006 $270,600 $86,600 $184,000
2023 $4,606 $256,200 $86,600 $169,600
2022 $4,606 $224,800 $86,600 $138,200
2021 $4,461 $194,300 $95,100 $99,200
2020 $4,348 $194,300 $95,100 $99,200
2019 $4,236 $194,300 $95,100 $99,200
2018 $4,044 $178,600 $95,100 $83,500
2017 $3,929 $178,600 $95,100 $83,500
2016 $3,912 $181,100 $101,000 $80,100
2015 $3,781 $181,100 $101,000 $80,100
Source: Public Records

Agents Affiliated with this Home

  • Section Image
See All Agents

Map