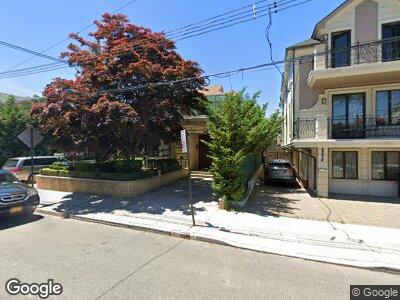
120 Kensington St Brooklyn, NY 11235
Manhattan Beach NeighborhoodEstimated Value: $1,805,000 - $3,295,000
--
Bed
--
Bath
2,482
Sq Ft
$1,043/Sq Ft
Est. Value
About This Home
This home is located at 120 Kensington St, Brooklyn, NY 11235 and is currently estimated at $2,588,767, approximately $1,043 per square foot. 120 Kensington St is a home located in Kings County with nearby schools including P.S. 195 Manhattan Beach, P.S. K225 - The Eileen E. Zaglin School, and Abraham Lincoln High School.
Ownership History
Date
Name
Owned For
Owner Type
Purchase Details
Closed on
Dec 17, 2021
Sold by
Pinkus Stanley and Pinkusovich Alexander
Bought by
Kolesnik Anna and Korogodskiy Igor
Current Estimated Value
Home Financials for this Owner
Home Financials are based on the most recent Mortgage that was taken out on this home.
Original Mortgage
$2,140,000
Outstanding Balance
$2,016,212
Interest Rate
3.12%
Mortgage Type
Purchase Money Mortgage
Estimated Equity
$255,118
Purchase Details
Closed on
Sep 20, 2002
Sold by
Pinkusovich Alexander
Bought by
Pinkusovich Alexander and Pinkusovich Svetlana
Purchase Details
Closed on
Jun 8, 1999
Sold by
Teplitsky Michael J
Bought by
Pinkusovich Alexander and Pinkusovich Svetlana
Home Financials for this Owner
Home Financials are based on the most recent Mortgage that was taken out on this home.
Original Mortgage
$895,500
Interest Rate
8%
Create a Home Valuation Report for This Property
The Home Valuation Report is an in-depth analysis detailing your home's value as well as a comparison with similar homes in the area
Home Values in the Area
Average Home Value in this Area
Purchase History
| Date | Buyer | Sale Price | Title Company |
|---|---|---|---|
| Kolesnik Anna | $2,750,000 | -- | |
| Pinkusovich Alexander | -- | -- | |
| Pinkusovich Alexander | $995,000 | Titlecrafters Inc |
Source: Public Records
Mortgage History
| Date | Status | Borrower | Loan Amount |
|---|---|---|---|
| Open | Kolesnik Anna | $2,140,000 | |
| Previous Owner | Pinkusovich Alexander | $32,332 | |
| Previous Owner | Pinkusovich Alexander | $895,500 |
Source: Public Records
Tax History Compared to Growth
Tax History
| Year | Tax Paid | Tax Assessment Tax Assessment Total Assessment is a certain percentage of the fair market value that is determined by local assessors to be the total taxable value of land and additions on the property. | Land | Improvement |
|---|---|---|---|---|
| 2024 | $21,053 | $104,820 | $46,740 | $58,080 |
| 2023 | $21,669 | $128,100 | $46,740 | $81,360 |
| 2022 | $20,137 | $123,240 | $46,740 | $76,500 |
| 2021 | $19,730 | $95,160 | $46,740 | $48,420 |
| 2020 | $14,798 | $115,380 | $46,740 | $68,640 |
| 2019 | $18,307 | $127,620 | $46,740 | $80,880 |
| 2018 | $17,828 | $88,915 | $24,320 | $64,595 |
| 2017 | $17,689 | $88,245 | $33,468 | $54,777 |
| 2016 | $16,333 | $83,251 | $26,832 | $56,419 |
| 2015 | $9,821 | $78,540 | $35,480 | $43,060 |
| 2014 | $9,821 | $74,096 | $33,473 | $40,623 |
Source: Public Records
Map
Nearby Homes
- 135 Jaffray St
- 158 Jaffray St
- 182 Kensington St
- 165 Langham St
- 178 Mackenzie St
- 159 Hastings St Unit 2
- 159 Hastings St
- 176 Irwin St
- 168 Norfolk St
- 119 Norfolk St
- 118 Girard St
- 12 Girard St
- 185 Oxford St Unit 39
- 185 Oxford St
- 194 Falmouth St
- 194 Falmouth St
- 4817 Bedford Ave Unit 3A
- 4800 Bedford Ave Unit 1C
- 14 Webers Ct
- 4094 Ocean Ave