Estimated Value: $812,579 - $994,000
3
Beds
2
Baths
1,134
Sq Ft
$805/Sq Ft
Est. Value
About This Home
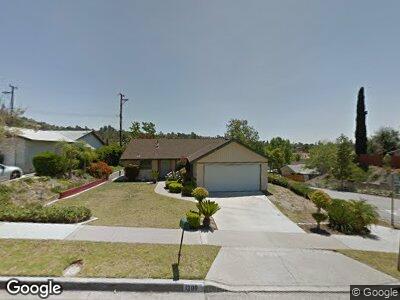
This home is located at 1200 Mariposa Dr, Brea, CA 92821 and is currently estimated at $913,395, approximately $805 per square foot. 1200 Mariposa Dr is a home located in Orange County with nearby schools including Mariposa Elementary School, Brea Junior High School, and Brea-Olinda High School.
Ownership History
Date
Name
Owned For
Owner Type
Purchase Details
Closed on
Jul 14, 2023
Sold by
Williams Ted F and Williams Betty R
Bought by
Franklin Williams And Betty Ruth Williams Fam and Williams
Current Estimated Value
Purchase Details
Closed on
Aug 1, 2003
Sold by
Michael Kamal
Bought by
Williams Ted F and Williams Betty R
Purchase Details
Closed on
Sep 13, 2001
Sold by
Michael Rival
Bought by
Michael Kamal
Home Financials for this Owner
Home Financials are based on the most recent Mortgage that was taken out on this home.
Original Mortgage
$39,300
Interest Rate
6.99%
Mortgage Type
Stand Alone Second
Purchase Details
Closed on
Aug 10, 2001
Sold by
Sammons John R and Sammons Linda J
Bought by
Michael Kamal
Home Financials for this Owner
Home Financials are based on the most recent Mortgage that was taken out on this home.
Original Mortgage
$39,300
Interest Rate
6.99%
Mortgage Type
Stand Alone Second
Create a Home Valuation Report for This Property
The Home Valuation Report is an in-depth analysis detailing your home's value as well as a comparison with similar homes in the area
Home Values in the Area
Average Home Value in this Area
Purchase History
| Date | Buyer | Sale Price | Title Company |
|---|---|---|---|
| Franklin Williams And Betty Ruth Williams Fam | -- | None Listed On Document | |
| Williams Ted F | $395,000 | Chicago Title Co | |
| Michael Kamal | -- | American Title Co | |
| Michael Kamal | $262,000 | American Title Co |
Source: Public Records
Mortgage History
| Date | Status | Borrower | Loan Amount |
|---|---|---|---|
| Previous Owner | Michael Kamal | $292,500 | |
| Previous Owner | Michael Kamal | $39,300 | |
| Previous Owner | Michael Kamal | $209,600 |
Source: Public Records
Tax History Compared to Growth
Tax History
| Year | Tax Paid | Tax Assessment Tax Assessment Total Assessment is a certain percentage of the fair market value that is determined by local assessors to be the total taxable value of land and additions on the property. | Land | Improvement |
|---|---|---|---|---|
| 2024 | $6,426 | $550,590 | $483,502 | $67,088 |
| 2023 | $6,250 | $539,795 | $474,022 | $65,773 |
| 2022 | $6,191 | $529,211 | $464,727 | $64,484 |
| 2021 | $6,075 | $518,835 | $455,615 | $63,220 |
| 2020 | $6,035 | $513,515 | $450,943 | $62,572 |
| 2019 | $5,874 | $503,447 | $442,101 | $61,346 |
| 2018 | $5,786 | $493,576 | $433,432 | $60,144 |
| 2017 | $5,678 | $483,899 | $424,934 | $58,965 |
| 2016 | $5,566 | $474,411 | $416,602 | $57,809 |
| 2015 | $5,294 | $449,580 | $397,478 | $52,102 |
| 2014 | $5,237 | $449,580 | $397,478 | $52,102 |
Source: Public Records
Map
Nearby Homes
- 1290 Ponderosa Ave
- 1020 Mariposa Dr
- 379 Glenoaks St
- 550 Pepper Tree Dr
- 138 Rustic Ct
- 436 W Central Ave
- 926 Kings Canyon Rd
- 1051 Site Dr Unit 133
- 1051 Site Dr Unit 231
- 1051 Site Dr Unit 109
- 640 Cliffwood Ave
- 306 Calico Ct
- 360 Mountain Ct
- 501 Candlewood St
- 584 Brookwood St
- 817 Hurst Place
- 705 Oakcrest Ave
- 942 Buttonwood Dr
- 54 Paseo De Toner
- 23 Paseo De Toner