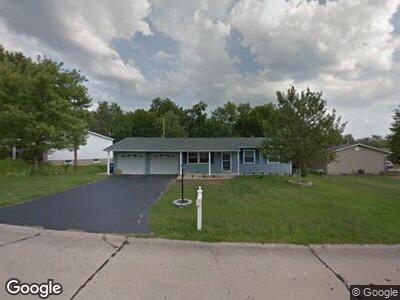
12016 Glenbrook Dr Maryland Heights, MO 63043
Estimated Value: $231,876 - $266,000
3
Beds
2
Baths
1,036
Sq Ft
$243/Sq Ft
Est. Value
About This Home
This home is located at 12016 Glenbrook Dr, Maryland Heights, MO 63043 and is currently estimated at $251,469, approximately $242 per square foot. 12016 Glenbrook Dr is a home located in St. Louis County with nearby schools including Rose Acres Elementary, Holman Middle School, and Pattonville High School.
Ownership History
Date
Name
Owned For
Owner Type
Purchase Details
Closed on
Dec 16, 2011
Sold by
Jm Ps Enterprises Llc
Bought by
Bates Jimmy and Bates Darcy
Current Estimated Value
Home Financials for this Owner
Home Financials are based on the most recent Mortgage that was taken out on this home.
Original Mortgage
$125,729
Interest Rate
3.87%
Mortgage Type
FHA
Purchase Details
Closed on
Aug 25, 2011
Sold by
Fannie Mae
Bought by
Jm Ps Enterprisess Llc
Home Financials for this Owner
Home Financials are based on the most recent Mortgage that was taken out on this home.
Original Mortgage
$74,080
Interest Rate
4.53%
Mortgage Type
Purchase Money Mortgage
Purchase Details
Closed on
Dec 2, 2010
Sold by
Kelly Marcia S
Bought by
Federal National Mortgage Association
Purchase Details
Closed on
Oct 26, 2005
Sold by
Kelly William C
Bought by
Kelly Marcia S
Home Financials for this Owner
Home Financials are based on the most recent Mortgage that was taken out on this home.
Original Mortgage
$133,500
Interest Rate
5.9%
Mortgage Type
Fannie Mae Freddie Mac
Create a Home Valuation Report for This Property
The Home Valuation Report is an in-depth analysis detailing your home's value as well as a comparison with similar homes in the area
Home Values in the Area
Average Home Value in this Area
Purchase History
| Date | Buyer | Sale Price | Title Company |
|---|---|---|---|
| Bates Jimmy | $129,000 | None Available | |
| Jm Ps Enterprisess Llc | $75,000 | None Available | |
| Federal National Mortgage Association | $160,370 | None Available |
Source: Public Records
Mortgage History
| Date | Status | Borrower | Loan Amount |
|---|---|---|---|
| Open | Bates Jimmy | $134,000 | |
| Closed | Bates Jimmy | $19,750 | |
| Closed | Bates Jimmy | $140,000 | |
| Closed | Bates Jimmy | $125,729 | |
| Previous Owner | Jm Ps Enterprisess Llc | $74,080 | |
| Previous Owner | Kelly Marcia S | $15,482 | |
| Previous Owner | Kelly Marcia S | $133,500 |
Source: Public Records
Tax History Compared to Growth
Tax History
| Year | Tax Paid | Tax Assessment Tax Assessment Total Assessment is a certain percentage of the fair market value that is determined by local assessors to be the total taxable value of land and additions on the property. | Land | Improvement |
|---|---|---|---|---|
| 2023 | $3,135 | $38,890 | $8,950 | $29,940 |
| 2022 | $2,956 | $33,060 | $10,580 | $22,480 |
| 2021 | $2,923 | $33,060 | $10,580 | $22,480 |
| 2020 | $2,653 | $29,090 | $9,770 | $19,320 |
| 2019 | $2,661 | $29,090 | $9,770 | $19,320 |
| 2018 | $2,617 | $26,410 | $6,860 | $19,550 |
| 2017 | $2,577 | $26,410 | $6,860 | $19,550 |
| 2016 | $2,374 | $23,870 | $5,150 | $18,720 |
| 2015 | $2,352 | $23,870 | $5,150 | $18,720 |
| 2014 | $2,329 | $23,530 | $3,880 | $19,650 |
Source: Public Records
Map
Nearby Homes
- 31 Bennington Ct
- 2823 Glenway Dr
- 11940 Kentwood Dr
- 2627 Glenoak Dr
- 12071 Renaissance Dr
- 2525 Salem Dr
- 12241 Bennington Place
- 11940 Meadow Run Ct
- 12160 Nantucket Place
- 2680 Chatham Dr
- 11971 Meadow Grove Ct
- 2686 Creve Coeur Mill Rd
- 2397 Meadowpark Ct
- 12109 Autumn Lakes Dr
- 2317 Country Village Ct
- 2734 Arrow Heights Dr
- 2721 Arrow Heights Dr
- 3026 Autumn Shores Dr
- 11827 McKelvey Gardens Dr
- 3110 Autumn Shores Dr Unit 445