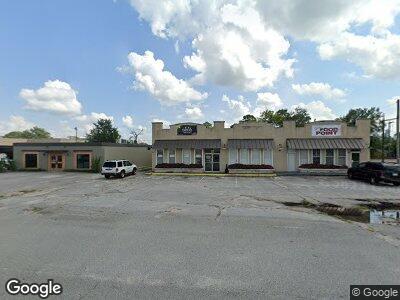
1209 D Ave West Columbia, SC 29169
Estimated Value: $289,325
--
Bed
--
Bath
6,000
Sq Ft
$48/Sq Ft
Est. Value
About This Home
This home is located at 1209 D Ave, West Columbia, SC 29169 and is currently estimated at $289,325, approximately $48 per square foot. 1209 D Ave is a home located in Lexington County with nearby schools including Cayce Elementary, Cyril B. Busbee Creative Arts Academy, and Brookland-Cayce High School.
Ownership History
Date
Name
Owned For
Owner Type
Purchase Details
Closed on
Dec 23, 2020
Sold by
The Moye Company Llc
Bought by
Carolina Signs & Designs Llc
Current Estimated Value
Home Financials for this Owner
Home Financials are based on the most recent Mortgage that was taken out on this home.
Original Mortgage
$133,312
Outstanding Balance
$121,304
Interest Rate
2.8%
Mortgage Type
Land Contract Argmt. Of Sale
Estimated Equity
$167,691
Purchase Details
Closed on
Nov 22, 2017
Sold by
The Moye Company Llc
Bought by
Caroline Sings & Design Llc
Home Financials for this Owner
Home Financials are based on the most recent Mortgage that was taken out on this home.
Original Mortgage
$24,000
Interest Rate
3.91%
Purchase Details
Closed on
Jun 29, 2006
Sold by
Estate Of Ina J Collier and Lamons Patricia C
Bought by
The Moye Co Llc
Home Financials for this Owner
Home Financials are based on the most recent Mortgage that was taken out on this home.
Original Mortgage
$155,000
Interest Rate
6.55%
Mortgage Type
Commercial
Create a Home Valuation Report for This Property
The Home Valuation Report is an in-depth analysis detailing your home's value as well as a comparison with similar homes in the area
Home Values in the Area
Average Home Value in this Area
Purchase History
| Date | Buyer | Sale Price | Title Company |
|---|---|---|---|
| Carolina Signs & Designs Llc | $240,000 | None Available | |
| Caroline Sings & Design Llc | -- | None Available | |
| The Moye Co Llc | $145,000 | None Available |
Source: Public Records
Mortgage History
| Date | Status | Borrower | Loan Amount |
|---|---|---|---|
| Open | Carolina Signs & Designs Llc | $133,312 | |
| Closed | Caroline Sings & Design Llc | $24,000 | |
| Closed | The Moye Co Llc | $325,000 | |
| Closed | The Moye Co Llc | $155,000 |
Source: Public Records
Tax History Compared to Growth
Tax History
| Year | Tax Paid | Tax Assessment Tax Assessment Total Assessment is a certain percentage of the fair market value that is determined by local assessors to be the total taxable value of land and additions on the property. | Land | Improvement |
|---|---|---|---|---|
| 2024 | $5,697 | $14,425 | $9,720 | $4,705 |
| 2023 | $5,697 | $14,425 | $9,720 | $4,705 |
| 2022 | $5,395 | $14,425 | $9,720 | $4,705 |
| 2020 | $5,115 | $14,425 | $9,720 | $4,705 |
| 2019 | $5,157 | $14,400 | $9,720 | $4,680 |
| 2018 | $6,077 | $17,109 | $9,720 | $7,389 |
| 2017 | $3,970 | $11,385 | $6,468 | $4,917 |
| 2016 | $4,017 | $11,384 | $6,468 | $4,916 |
| 2014 | $3,033 | $9,899 | $5,400 | $4,499 |
| 2013 | -- | $9,900 | $5,400 | $4,500 |
Source: Public Records
Map
Nearby Homes