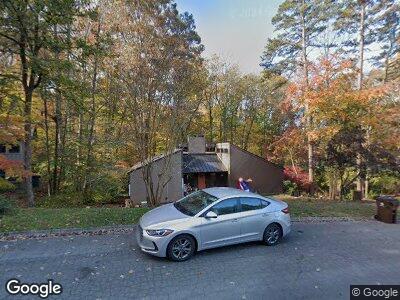
121 Brentwood Dr Oak Ridge, TN 37830
Estimated Value: $465,453 - $560,000
4
Beds
3
Baths
3,440
Sq Ft
$152/Sq Ft
Est. Value
About This Home
This home is located at 121 Brentwood Dr, Oak Ridge, TN 37830 and is currently estimated at $523,113, approximately $152 per square foot. 121 Brentwood Dr is a home located in Anderson County with nearby schools including Woodland Elementary School, Jefferson Middle School, and Oak Ridge High School.
Ownership History
Date
Name
Owned For
Owner Type
Purchase Details
Closed on
May 17, 2022
Sold by
Hagan Jr Charles W
Bought by
Blijlevens Jeroen Wilhelmus and Blijlevens Shannon Marie
Current Estimated Value
Home Financials for this Owner
Home Financials are based on the most recent Mortgage that was taken out on this home.
Original Mortgage
$312,000
Outstanding Balance
$299,024
Interest Rate
5.3%
Mortgage Type
New Conventional
Estimated Equity
$204,988
Purchase Details
Closed on
Oct 20, 2008
Sold by
Rogers Thomas C
Bought by
Hagan Charles W
Home Financials for this Owner
Home Financials are based on the most recent Mortgage that was taken out on this home.
Original Mortgage
$206,400
Interest Rate
5.78%
Purchase Details
Closed on
Sep 16, 1988
Bought by
Rodgers Thomas C and Rodgers Wife Mary Kathleen
Purchase Details
Closed on
Jan 1, 1984
Create a Home Valuation Report for This Property
The Home Valuation Report is an in-depth analysis detailing your home's value as well as a comparison with similar homes in the area
Home Values in the Area
Average Home Value in this Area
Purchase History
| Date | Buyer | Sale Price | Title Company |
|---|---|---|---|
| Blijlevens Jeroen Wilhelmus | $390,000 | Admiral Title Inc | |
| Hagan Charles W | $258,000 | -- | |
| Rodgers Thomas C | $157,500 | -- | |
| -- | $135,000 | -- |
Source: Public Records
Mortgage History
| Date | Status | Borrower | Loan Amount |
|---|---|---|---|
| Open | Blijlevens Jeroen Wilhelmus | $312,000 | |
| Previous Owner | -- | $206,400 | |
| Previous Owner | Rogers Thomas C | $230,000 |
Source: Public Records
Tax History Compared to Growth
Tax History
| Year | Tax Paid | Tax Assessment Tax Assessment Total Assessment is a certain percentage of the fair market value that is determined by local assessors to be the total taxable value of land and additions on the property. | Land | Improvement |
|---|---|---|---|---|
| 2024 | $1,747 | $71,125 | $11,925 | $59,200 |
| 2023 | $1,747 | $71,125 | $0 | $0 |
| 2022 | $3,393 | $71,125 | $11,925 | $59,200 |
| 2021 | $3,393 | $71,125 | $11,925 | $59,200 |
| 2020 | $1,747 | $71,125 | $11,925 | $59,200 |
| 2019 | $3,192 | $60,750 | $10,600 | $50,150 |
| 2018 | $3,119 | $60,750 | $10,600 | $50,150 |
| 2017 | $3,107 | $60,750 | $10,600 | $50,150 |
| 2016 | $3,107 | $60,750 | $10,600 | $50,150 |
| 2015 | -- | $60,750 | $10,600 | $50,150 |
| 2014 | -- | $60,750 | $10,600 | $50,150 |
| 2013 | -- | $69,975 | $0 | $0 |
Source: Public Records
Map
Nearby Homes
- 108 Barrington Dr
- 230 Briarcliff Ave
- 107 Carson Ln
- 103 Baltimore Dr
- 114 Dansworth Ln
- 109 Dayton Rd
- 109 Balsam Rd
- 126 Wolf Creek Way
- 103 Cove Pointe Ln
- 168 Cumberland View Dr
- 107 Hazleton Ln
- 112 Balsam Rd
- 170 Cumberland View Dr
- 98 Hampshire Cir
- 115 Crossroads Blvd
- 45 Palisades Pkwy
- 15 Asbury Ln
- 101 Townsend Rd
- 201 E Tennessee Ave
- 225 - 231 W West Fairview Rd