Estimated Value: $194,000 - $268,000
--
Bed
--
Bath
2,402
Sq Ft
$94/Sq Ft
Est. Value
About This Home
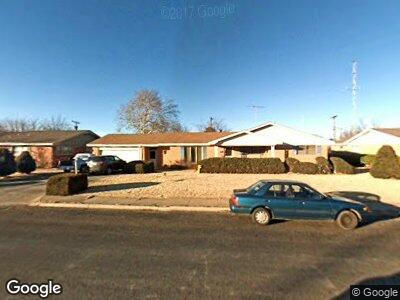
This home is located at 121 E 26th Ave, Pampa, TX 79065 and is currently estimated at $225,206, approximately $93 per square foot. 121 E 26th Ave is a home located in Gray County with nearby schools including Austin Elementary School, Pampa Junior High School, and Pampa High School.
Ownership History
Date
Name
Owned For
Owner Type
Purchase Details
Closed on
Nov 5, 2021
Sold by
Martindale Casey and Martindale Jaycee
Bought by
Rangel Kristin L
Current Estimated Value
Home Financials for this Owner
Home Financials are based on the most recent Mortgage that was taken out on this home.
Original Mortgage
$172,975
Outstanding Balance
$160,604
Interest Rate
2.88%
Mortgage Type
New Conventional
Estimated Equity
$64,602
Purchase Details
Closed on
May 19, 2016
Sold by
East John C
Bought by
Martindale Casey and Devoll Jaycee
Home Financials for this Owner
Home Financials are based on the most recent Mortgage that was taken out on this home.
Original Mortgage
$82,500
Interest Rate
3.59%
Mortgage Type
Construction
Purchase Details
Closed on
Mar 25, 2013
Sold by
Myers Roger Zirl and Myers Trudy Genee
Bought by
East John C
Home Financials for this Owner
Home Financials are based on the most recent Mortgage that was taken out on this home.
Original Mortgage
$99,846
Interest Rate
3.59%
Mortgage Type
New Conventional
Create a Home Valuation Report for This Property
The Home Valuation Report is an in-depth analysis detailing your home's value as well as a comparison with similar homes in the area
Home Values in the Area
Average Home Value in this Area
Purchase History
| Date | Buyer | Sale Price | Title Company |
|---|---|---|---|
| Rangel Kristin L | -- | None Available | |
| Martindale Casey | -- | Great Plains Abstract & Titl | |
| East John C | -- | Gray County Title Co Inc |
Source: Public Records
Mortgage History
| Date | Status | Borrower | Loan Amount |
|---|---|---|---|
| Open | Rangel Kristin L | $172,975 | |
| Previous Owner | Martindale Casey | $82,500 | |
| Previous Owner | East John C | $99,846 |
Source: Public Records
Tax History Compared to Growth
Tax History
| Year | Tax Paid | Tax Assessment Tax Assessment Total Assessment is a certain percentage of the fair market value that is determined by local assessors to be the total taxable value of land and additions on the property. | Land | Improvement |
|---|---|---|---|---|
| 2024 | $4,741 | $188,950 | $10,260 | $178,690 |
| 2023 | $4,265 | $163,400 | $10,260 | $153,140 |
| 2022 | $3,265 | $124,610 | $10,260 | $114,350 |
| 2021 | $3,368 | $124,610 | $10,260 | $114,350 |
| 2020 | $3,351 | $124,610 | $10,260 | $114,350 |
| 2019 | $3,131 | $115,710 | $10,260 | $105,450 |
| 2018 | $3,108 | $115,710 | $10,260 | $105,450 |
| 2017 | $3,095 | $115,710 | $10,260 | $105,450 |
| 2016 | $2,723 | $106,690 | $10,260 | $96,430 |
| 2015 | -- | $108,050 | $10,260 | $97,790 |
| 2014 | -- | $110,770 | $10,260 | $100,510 |
Source: Public Records
Map
Nearby Homes
- 101 E 26th Ave
- 2527 N Duncan St
- 2706 N Duncan St
- 2425 N Christine St
- 2421 Duncan St
- 2501 Beech Ln
- 2373 N Beech Ln
- 2410 Perryton Pkwy
- 2353 N Chestnut Dr
- 2310 N Aspen Dr
- 2318 N Beech Ln
- 2234 Christine St
- 2225 N Mary-Ellen St
- 2215 Beech Ln
- 904 Terry Rd
- 2235 Williston St
- 2223 N Chestnut Dr
- 2304 N Dogwood Ln
- 0 30th Ave W Unit 25-1550
- 0 30th Ave W Unit 25-1549