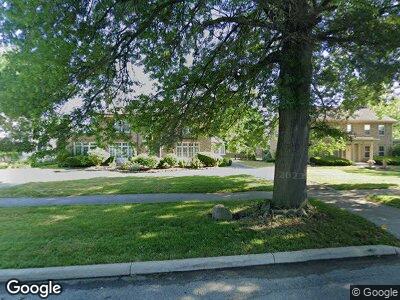
121 Peashway St South Bend, IN 46617
Harter Heights NeighborhoodEstimated Value: $578,000 - $729,000
5
Beds
4
Baths
3,162
Sq Ft
$212/Sq Ft
Est. Value
About This Home
This home is located at 121 Peashway St, South Bend, IN 46617 and is currently estimated at $670,008, approximately $211 per square foot. 121 Peashway St is a home located in St. Joseph County with nearby schools including Nuner Fine Arts Academy, Edison Middle School, and Adams High School.
Ownership History
Date
Name
Owned For
Owner Type
Purchase Details
Closed on
Jul 29, 2016
Sold by
Szakaly John S
Bought by
Masse Daniel and Masse Kimberly
Current Estimated Value
Home Financials for this Owner
Home Financials are based on the most recent Mortgage that was taken out on this home.
Original Mortgage
$240,000
Outstanding Balance
$194,933
Interest Rate
3.54%
Mortgage Type
New Conventional
Estimated Equity
$475,075
Create a Home Valuation Report for This Property
The Home Valuation Report is an in-depth analysis detailing your home's value as well as a comparison with similar homes in the area
Home Values in the Area
Average Home Value in this Area
Purchase History
| Date | Buyer | Sale Price | Title Company |
|---|---|---|---|
| Masse Daniel | -- | -- |
Source: Public Records
Mortgage History
| Date | Status | Borrower | Loan Amount |
|---|---|---|---|
| Open | Masse Daniel | $240,000 |
Source: Public Records
Tax History Compared to Growth
Tax History
| Year | Tax Paid | Tax Assessment Tax Assessment Total Assessment is a certain percentage of the fair market value that is determined by local assessors to be the total taxable value of land and additions on the property. | Land | Improvement |
|---|---|---|---|---|
| 2024 | $11,696 | $1,119,400 | $43,100 | $1,076,300 |
| 2023 | $9,856 | $488,800 | $43,200 | $445,600 |
| 2022 | $9,856 | $410,700 | $43,200 | $367,500 |
| 2021 | $8,718 | $361,400 | $64,500 | $296,900 |
| 2020 | $6,649 | $275,300 | $49,100 | $226,200 |
| 2019 | $5,369 | $303,200 | $47,600 | $255,600 |
| 2018 | $6,401 | $266,300 | $42,500 | $223,800 |
| 2017 | $6,641 | $344,500 | $42,500 | $302,000 |
| 2016 | $3,720 | $282,700 | $34,700 | $248,000 |
| 2014 | $4,657 | $351,400 | $66,500 | $284,900 |
Source: Public Records
Map
Nearby Homes
- 317 Napoleon St
- 402 E Pokagon St
- 902 Stanfield St
- 134 Wakewa Ave
- 122 E North Shore Dr
- 212 Marquette Ave
- 306 Tonti St
- 1010 Stanfield St
- 302 Howard St
- 514 Howard St
- 712 Peashway St
- 615 Napoleon St
- 627 Ostemo Place
- 214 Hammond Place
- 308 Lamonte Terrace
- 817 Leland Ave
- 1506 Marigold Way Unit 406 Way Unit 406
- 1069 Riverside Dr
- 712 California Ave
- 603 N Hill St