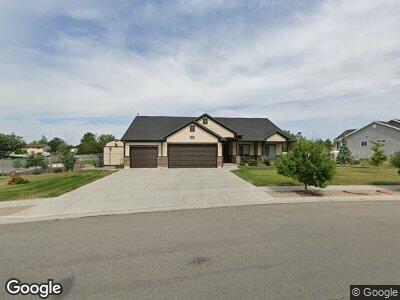
1211 N 150 E Harrisville, UT 84404
Harrisville NeighborhoodEstimated Value: $532,000 - $596,191
3
Beds
2
Baths
1,713
Sq Ft
$330/Sq Ft
Est. Value
About This Home
This home is located at 1211 N 150 E, Harrisville, UT 84404 and is currently estimated at $564,798, approximately $329 per square foot. 1211 N 150 E is a home located in Weber County with nearby schools including Pioneer School, Orion Junior High School, and Weber High School.
Ownership History
Date
Name
Owned For
Owner Type
Purchase Details
Closed on
Dec 14, 2023
Sold by
Kas Steven
Bought by
Brent And Desann Griffiths Family Trust and Griffiths
Current Estimated Value
Purchase Details
Closed on
Dec 2, 2021
Sold by
Knight Thomas J and Knight Christine
Bought by
Kas Steven
Home Financials for this Owner
Home Financials are based on the most recent Mortgage that was taken out on this home.
Original Mortgage
$431,250
Interest Rate
3.09%
Mortgage Type
New Conventional
Purchase Details
Closed on
Oct 22, 2014
Sold by
Mountain View Title & Escrow Inc
Bought by
Scotts Homes Construction Llc
Purchase Details
Closed on
Apr 17, 2014
Sold by
Reboot Llc
Bought by
Mountain View Title & Escrow Inc and Reboot Llc
Home Financials for this Owner
Home Financials are based on the most recent Mortgage that was taken out on this home.
Original Mortgage
$842,697
Interest Rate
4.3%
Mortgage Type
Unknown
Create a Home Valuation Report for This Property
The Home Valuation Report is an in-depth analysis detailing your home's value as well as a comparison with similar homes in the area
Home Values in the Area
Average Home Value in this Area
Purchase History
| Date | Buyer | Sale Price | Title Company |
|---|---|---|---|
| Brent And Desann Griffiths Family Trust | -- | Us Title | |
| Kas Steven | -- | Old Republic Title | |
| Scotts Homes Construction Llc | -- | Mountain View Title | |
| Mountain View Title & Escrow Inc | -- | Mountain View Title |
Source: Public Records
Mortgage History
| Date | Status | Borrower | Loan Amount |
|---|---|---|---|
| Previous Owner | Kas Steven | $431,250 | |
| Previous Owner | Reboot Llc | $842,697 | |
| Previous Owner | Reboot Llc | $179,539 |
Source: Public Records
Tax History Compared to Growth
Tax History
| Year | Tax Paid | Tax Assessment Tax Assessment Total Assessment is a certain percentage of the fair market value that is determined by local assessors to be the total taxable value of land and additions on the property. | Land | Improvement |
|---|---|---|---|---|
| 2024 | $3,735 | $298,099 | $116,816 | $181,283 |
| 2023 | $287 | $314,050 | $116,421 | $197,629 |
| 2022 | $745 | $298,650 | $88,861 | $209,789 |
| 2021 | $2,628 | $442,000 | $106,555 | $335,445 |
| 2020 | $2,403 | $379,000 | $81,059 | $297,941 |
| 2019 | $2,299 | $346,000 | $76,023 | $269,977 |
| 2018 | $2,345 | $339,033 | $74,035 | $264,998 |
| 2017 | $2,600 | $304,000 | $74,035 | $229,965 |
| 2016 | $2,449 | $154,447 | $33,670 | $120,777 |
| 2015 | $930 | $46,156 | $46,156 | $0 |
| 2014 | -- | $0 | $0 | $0 |
Source: Public Records
Map
Nearby Homes
- 129 W 1250 N
- 221 Brookmeadow Dr
- 1222 N Massachusetts Cir
- 1117 N Virginia Ave
- 276 E 1500 St N
- 930 N Wahlen Way
- 403 W 1225 N Unit 7
- 347 W 1125 N Unit 16
- 1135 N 375 W Unit 12
- 371 W 1125 N Unit 14
- 344 W 1125 N Unit LOT 19
- 1162 N 375 W Unit 22
- 1170 N 375 W Unit 23
- 1147 N 375 W Unit 11
- 1201 N 525 E
- 1450 N Washington Blvd
- 1450 N Washington Blvd Unit 112
- 406 W 1225 N Unit 4
- 488 E 1100 N
- 265 E Larsen Ln