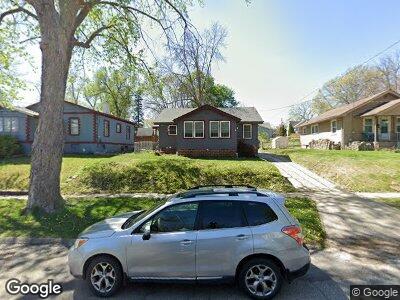
1212 56th St Des Moines, IA 50311
Merle Hay NeighborhoodEstimated Value: $168,000 - $228,000
2
Beds
1
Bath
768
Sq Ft
$260/Sq Ft
Est. Value
About This Home
This home is located at 1212 56th St, Des Moines, IA 50311 and is currently estimated at $199,355, approximately $259 per square foot. 1212 56th St is a home located in Polk County with nearby schools including Windsor Elementary School, Merrill Middle School, and Roosevelt High School.
Ownership History
Date
Name
Owned For
Owner Type
Purchase Details
Closed on
Jun 11, 2019
Sold by
Tigges Mark and Tigges Angela
Bought by
Jordan Thomas B
Current Estimated Value
Home Financials for this Owner
Home Financials are based on the most recent Mortgage that was taken out on this home.
Original Mortgage
$152,192
Outstanding Balance
$136,473
Interest Rate
4.62%
Mortgage Type
FHA
Estimated Equity
$62,882
Purchase Details
Closed on
Jun 6, 2013
Sold by
Pnc Bank Na
Bought by
Secretary Of Hud
Purchase Details
Closed on
Nov 27, 2007
Sold by
Allen Madeline C
Bought by
Tigges Mark and Tigges Angela
Purchase Details
Closed on
Apr 9, 2003
Sold by
Allen Mabel E and Allen Madeline C
Bought by
Allen Mabel E and Allen Madeline C
Purchase Details
Closed on
Jan 15, 2000
Sold by
Allen Mabel E
Bought by
Allen Mabel E and Allen Madeline C
Purchase Details
Closed on
Apr 13, 1999
Sold by
Allen Robert G
Bought by
Allen Mabel E
Create a Home Valuation Report for This Property
The Home Valuation Report is an in-depth analysis detailing your home's value as well as a comparison with similar homes in the area
Home Values in the Area
Average Home Value in this Area
Purchase History
| Date | Buyer | Sale Price | Title Company |
|---|---|---|---|
| Jordan Thomas B | $155,000 | None Available | |
| Secretary Of Hud | -- | None Available | |
| Tigges Mark | $55,000 | None Available | |
| Allen Mabel E | -- | -- | |
| Allen Mabel E | -- | -- | |
| Allen Mabel E | -- | -- |
Source: Public Records
Mortgage History
| Date | Status | Borrower | Loan Amount |
|---|---|---|---|
| Open | Jordan Thomas B | $22,202 | |
| Open | Jordan Thomas B | $152,192 |
Source: Public Records
Tax History Compared to Growth
Tax History
| Year | Tax Paid | Tax Assessment Tax Assessment Total Assessment is a certain percentage of the fair market value that is determined by local assessors to be the total taxable value of land and additions on the property. | Land | Improvement |
|---|---|---|---|---|
| 2024 | $2,570 | $141,100 | $35,800 | $105,300 |
| 2023 | $2,670 | $141,100 | $35,800 | $105,300 |
| 2022 | $2,648 | $122,200 | $32,300 | $89,900 |
| 2021 | $2,398 | $122,200 | $32,300 | $89,900 |
| 2020 | $1,890 | $104,700 | $28,800 | $75,900 |
| 2019 | $1,866 | $104,700 | $28,800 | $75,900 |
| 2018 | $1,846 | $92,400 | $25,100 | $67,300 |
| 2017 | $1,556 | $92,400 | $25,100 | $67,300 |
| 2016 | $1,516 | $80,500 | $21,900 | $58,600 |
| 2015 | $1,516 | $80,500 | $21,900 | $58,600 |
| 2014 | $1,434 | $75,600 | $20,200 | $55,400 |
Source: Public Records
Map
Nearby Homes
- 1317 57th Place
- 1308 57th Place
- 1040 56th St
- 1010 56th St
- 6016 Carpenter Ave
- 1333 Cummins Pkwy
- 1508 57th Place
- 5909 Clark St
- 1334 62nd St
- 6207 Dagle Dr
- 5808 Chamberlain Dr
- 4902 University Ave Unit 325
- 6012 College Ave
- 1721 57th Place
- 1525 63rd St
- 6423 Carpenter Ave
- 1729 Merle Hay Rd
- 4823 Algonquin Rd
- 1303 48th St
- 1811 56th St