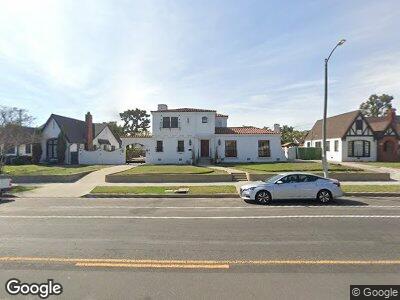
1215 N Banning Blvd Wilmington, CA 90744
Wilmington NeighborhoodEstimated Value: $857,000 - $1,372,000
4
Beds
2
Baths
2,849
Sq Ft
$384/Sq Ft
Est. Value
About This Home
This home is located at 1215 N Banning Blvd, Wilmington, CA 90744 and is currently estimated at $1,093,679, approximately $383 per square foot. 1215 N Banning Blvd is a home located in Los Angeles County with nearby schools including Harry Bridges Span School, Phineas Banning Senior High School, and Scholarship Prep South Bay.
Ownership History
Date
Name
Owned For
Owner Type
Purchase Details
Closed on
Jun 24, 2022
Sold by
Ponce Rebecca M
Bought by
Rebecca M Ponce Living Revocable Trust
Current Estimated Value
Home Financials for this Owner
Home Financials are based on the most recent Mortgage that was taken out on this home.
Original Mortgage
$200,000
Outstanding Balance
$192,923
Interest Rate
5.25%
Mortgage Type
Balloon
Estimated Equity
$885,883
Purchase Details
Closed on
May 31, 2022
Sold by
Rebecca M Ponce Living Revocable Trust
Bought by
Lopez Jesse and Lopez Doreen
Home Financials for this Owner
Home Financials are based on the most recent Mortgage that was taken out on this home.
Original Mortgage
$200,000
Outstanding Balance
$192,923
Interest Rate
5.25%
Mortgage Type
Balloon
Estimated Equity
$885,883
Purchase Details
Closed on
Dec 2, 2011
Sold by
Ponce Rebecca M
Bought by
Ponce Rebecca M and The Rebecca M Ponce Living Revocable Tru
Create a Home Valuation Report for This Property
The Home Valuation Report is an in-depth analysis detailing your home's value as well as a comparison with similar homes in the area
Home Values in the Area
Average Home Value in this Area
Purchase History
| Date | Buyer | Sale Price | Title Company |
|---|---|---|---|
| Lopez Jesse | $1,200,000 | Usa National Title | |
| Ponce Rebecca M | -- | None Available |
Source: Public Records
Mortgage History
| Date | Status | Borrower | Loan Amount |
|---|---|---|---|
| Open | Lopez Jesse | $200,000 | |
| Previous Owner | Ponce Rebecca M | $300,000 | |
| Previous Owner | Ponce Thomas B | $210,000 | |
| Previous Owner | Ponce Thomas B | $145,000 |
Source: Public Records
Tax History Compared to Growth
Tax History
| Year | Tax Paid | Tax Assessment Tax Assessment Total Assessment is a certain percentage of the fair market value that is determined by local assessors to be the total taxable value of land and additions on the property. | Land | Improvement |
|---|---|---|---|---|
| 2024 | $8,133 | $622,107 | $355,253 | $266,854 |
| 2023 | $7,985 | $609,910 | $348,288 | $261,622 |
| 2022 | $2,773 | $181,146 | $69,255 | $111,891 |
| 2021 | $2,728 | $177,596 | $67,898 | $109,698 |
| 2019 | $2,660 | $172,331 | $65,885 | $106,446 |
| 2018 | $2,462 | $168,953 | $64,594 | $104,359 |
| 2016 | $2,330 | $162,394 | $62,087 | $100,307 |
| 2015 | $2,301 | $159,956 | $61,155 | $98,801 |
| 2014 | $2,323 | $156,824 | $59,958 | $96,866 |
Source: Public Records
Map
Nearby Homes
- 1131 Lakme Ave
- 1206 Eubank Ave
- 130 E Opp St
- 1036 N Fries Ave
- 1060 Mcfarland Ave
- 900 E Denni St Unit 43
- 1123 Sanford Ave
- 1050 Lagoon Ave
- 1204 Ravenna Ave
- 908 Mcfarland Ave
- 432 E Q St
- 1023 E Mauretania St
- 1405 Lagoon Ave
- 1119 E M St
- 1119 E Colon St
- 1206 E Colon St
- 823 N Lagoon Ave
- 1433 N Neptune Ave
- 1711 N Banning Blvd
- 1319 E Colon St