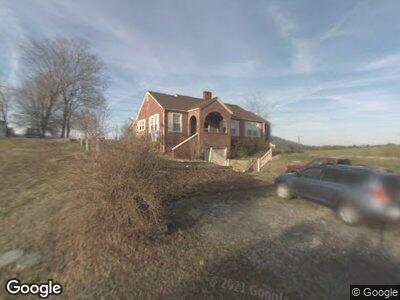
122 Church Ln Mooresburg, TN 37811
Mooresburg NeighborhoodEstimated Value: $172,389 - $309,000
--
Bed
1
Bath
1,385
Sq Ft
$171/Sq Ft
Est. Value
About This Home
This home is located at 122 Church Ln, Mooresburg, TN 37811 and is currently estimated at $237,097, approximately $171 per square foot. 122 Church Ln is a home located in Hawkins County with nearby schools including Mooresburg Elementary School, Rogersville Middle School, and Cherokee High School.
Ownership History
Date
Name
Owned For
Owner Type
Purchase Details
Closed on
Apr 9, 1999
Sold by
Campbell Michael H
Bought by
Charles Johnson
Current Estimated Value
Home Financials for this Owner
Home Financials are based on the most recent Mortgage that was taken out on this home.
Original Mortgage
$68,435
Interest Rate
7.08%
Purchase Details
Closed on
Dec 2, 1994
Bought by
Campbell Michael H and Campbell Melissa R
Purchase Details
Closed on
Mar 29, 1994
Bought by
Maggard Henry I and Maggard Ruth C
Purchase Details
Closed on
Jun 16, 1993
Bought by
Secretary Of Houseing
Purchase Details
Closed on
Oct 16, 1991
Bought by
Owen Brian Keith
Purchase Details
Closed on
Nov 17, 1987
Bought by
Associates Financial
Purchase Details
Closed on
Jun 10, 1983
Bought by
Gibbs Danny and Gibbs Joanne
Purchase Details
Closed on
Jun 1, 1941
Create a Home Valuation Report for This Property
The Home Valuation Report is an in-depth analysis detailing your home's value as well as a comparison with similar homes in the area
Home Values in the Area
Average Home Value in this Area
Purchase History
| Date | Buyer | Sale Price | Title Company |
|---|---|---|---|
| Charles Johnson | $69,000 | -- | |
| Campbell Michael H | $48,000 | -- | |
| Maggard Henry I | $41,500 | -- | |
| Secretary Of Houseing | $27,100 | -- | |
| Owen Brian Keith | -- | -- | |
| Associates Financial | -- | -- | |
| Gibbs Danny | -- | -- | |
| -- | -- | -- |
Source: Public Records
Mortgage History
| Date | Status | Borrower | Loan Amount |
|---|---|---|---|
| Open | Johnson Charles E | $102,920 | |
| Closed | Johnson Charles E | $2,014 | |
| Closed | Not Available | $68,435 | |
| Previous Owner | Campbell Micheal H | $15,000 |
Source: Public Records
Tax History Compared to Growth
Tax History
| Year | Tax Paid | Tax Assessment Tax Assessment Total Assessment is a certain percentage of the fair market value that is determined by local assessors to be the total taxable value of land and additions on the property. | Land | Improvement |
|---|---|---|---|---|
| 2024 | $819 | $32,050 | $2,925 | $29,125 |
| 2023 | $745 | $32,050 | $0 | $0 |
| 2022 | $743 | $32,050 | $2,925 | $29,125 |
| 2021 | $695 | $32,050 | $2,925 | $29,125 |
| 2020 | $641 | $32,050 | $2,925 | $29,125 |
| 2019 | $641 | $25,300 | $2,925 | $22,375 |
| 2018 | $641 | $25,300 | $2,925 | $22,375 |
| 2017 | $641 | $25,300 | $2,925 | $22,375 |
| 2016 | $641 | $25,300 | $2,925 | $22,375 |
| 2015 | $624 | $25,300 | $2,925 | $22,375 |
| 2014 | $678 | $27,525 | $2,925 | $24,600 |
Source: Public Records
Map
Nearby Homes
- 227 Holly Rd
- 310 J V Cir
- 9946 Highway 11w
- 9514 Highway 11w
- 118 Futuristic Rd
- 142 Owens Rd
- 701 Slate Hill Rd
- 155 Chelaque Way
- 715 Slate Hill Rd
- 1126 Keetoowah Dr
- 9099 Paradise View Dr
- 1163 Keetoowah Dr
- 1167 Keetoowah Dr
- 1184 Keetoowah Dr
- 1202 Keetoowah Dr
- 828 Wilderness Dr
- Lot 12 Moore Rd
- Lot 230 Harbor View
- 214/215 Harbor View
- 325 Mountain View Dr