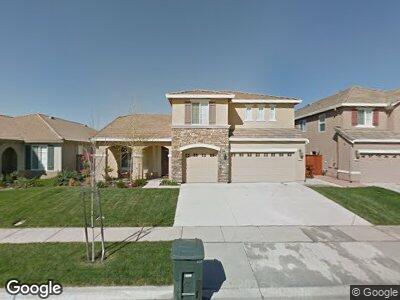
1235 Tulio St Yuba City, CA 95993
Outlying Yuba City NeighborhoodEstimated Value: $589,000 - $678,000
4
Beds
3
Baths
2,586
Sq Ft
$237/Sq Ft
Est. Value
About This Home
This home is located at 1235 Tulio St, Yuba City, CA 95993 and is currently estimated at $612,567, approximately $236 per square foot. 1235 Tulio St is a home located in Sutter County with nearby schools including Tierra Buena Elementary School, River Valley High School, and Faith Christian Schools.
Ownership History
Date
Name
Owned For
Owner Type
Purchase Details
Closed on
Jan 6, 2023
Sold by
Sahota Surinder Kaur
Bought by
Sahota Jagjit Singh
Current Estimated Value
Purchase Details
Closed on
Dec 28, 2022
Sold by
Surinder K Sahota 2010 Revocable Inter V
Bought by
Sahota Jagjit Singh
Purchase Details
Closed on
Oct 1, 2012
Sold by
Sahota Surinder K
Bought by
Sahota Surinder K
Home Financials for this Owner
Home Financials are based on the most recent Mortgage that was taken out on this home.
Original Mortgage
$164,028
Interest Rate
3.63%
Mortgage Type
New Conventional
Purchase Details
Closed on
Aug 19, 2010
Sold by
Sahota Surinder K
Bought by
Sahota Surinder K
Purchase Details
Closed on
May 26, 2009
Sold by
Centex Homes
Bought by
Sahota Surinder K
Home Financials for this Owner
Home Financials are based on the most recent Mortgage that was taken out on this home.
Original Mortgage
$175,025
Interest Rate
4.8%
Mortgage Type
Purchase Money Mortgage
Create a Home Valuation Report for This Property
The Home Valuation Report is an in-depth analysis detailing your home's value as well as a comparison with similar homes in the area
Home Values in the Area
Average Home Value in this Area
Purchase History
| Date | Buyer | Sale Price | Title Company |
|---|---|---|---|
| Sahota Jagjit Singh | -- | -- | |
| Sahota Surinder K | -- | Accommodation | |
| Sahota Surinder K | -- | Placer Title Company | |
| Sahota Surinder K | -- | None Available | |
| Sahota Surinder K | $280,500 | Commerce Title Company |
Source: Public Records
Mortgage History
| Date | Status | Borrower | Loan Amount |
|---|---|---|---|
| Previous Owner | Sahota Surinder K | $164,028 | |
| Previous Owner | Sahota Surinder K | $175,025 |
Source: Public Records
Tax History Compared to Growth
Tax History
| Year | Tax Paid | Tax Assessment Tax Assessment Total Assessment is a certain percentage of the fair market value that is determined by local assessors to be the total taxable value of land and additions on the property. | Land | Improvement |
|---|---|---|---|---|
| 2023 | $4,332 | $346,930 | $49,503 | $297,427 |
| 2022 | $4,155 | $340,129 | $48,533 | $291,596 |
| 2021 | $4,100 | $333,473 | $47,588 | $285,885 |
| 2020 | $4,028 | $330,053 | $47,100 | $282,953 |
| 2019 | $3,942 | $323,581 | $46,176 | $277,405 |
| 2018 | $3,846 | $317,235 | $45,271 | $271,964 |
| 2017 | $3,753 | $311,015 | $44,383 | $266,632 |
| 2016 | $3,676 | $304,916 | $43,513 | $261,403 |
| 2015 | $3,610 | $300,336 | $42,859 | $257,477 |
| 2014 | $3,277 | $294,453 | $42,020 | $252,433 |
Source: Public Records
Map
Nearby Homes
- 3457 Colusa Hwy
- 1164 Steidlmayer Way
- 3311 Sam Brannan Way
- 1438 Tori Ln
- 3316 Monroe Rd
- 3511 Jefferson Ave
- 2930 Jefferson Ave
- 2864 Jefferson Ave Unit 6
- 2903 Kennedy Dr
- 1132 Billie Keith Way
- 1167 Billie Keith Way
- 4361 Dresser Rd
- 1345 Hooper Rd
- 668 Gabriel Ave
- 1150 El Margarita Rd
- 4423 Dresser Rd
- 1716 Tierra Buena Rd
- 1983 Hooper Rd
- 1883 Villa Ave
- 1223 Strawberry Dr