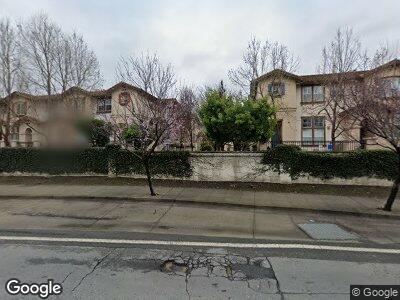
124 Abella Cir San Pablo, CA 94806
Estimated Value: $577,000 - $698,000
3
Beds
3
Baths
1,745
Sq Ft
$380/Sq Ft
Est. Value
About This Home
This home is located at 124 Abella Cir, San Pablo, CA 94806 and is currently estimated at $662,984, approximately $379 per square foot. 124 Abella Cir is a home located in Contra Costa County with nearby schools including Lake Elementary School, Walter T. Helms Middle School, and Richmond High School.
Ownership History
Date
Name
Owned For
Owner Type
Purchase Details
Closed on
Jan 20, 2023
Sold by
Ng Yu Chun and Ng Yang
Bought by
Li Yihong
Current Estimated Value
Home Financials for this Owner
Home Financials are based on the most recent Mortgage that was taken out on this home.
Original Mortgage
$250,000
Outstanding Balance
$244,546
Interest Rate
6.31%
Mortgage Type
New Conventional
Estimated Equity
$486,129
Purchase Details
Closed on
Dec 2, 2003
Sold by
Signature At Abella Llc
Bought by
Ng Yu Chun and Lee Yang
Home Financials for this Owner
Home Financials are based on the most recent Mortgage that was taken out on this home.
Original Mortgage
$333,700
Interest Rate
6.03%
Mortgage Type
Purchase Money Mortgage
Create a Home Valuation Report for This Property
The Home Valuation Report is an in-depth analysis detailing your home's value as well as a comparison with similar homes in the area
Home Values in the Area
Average Home Value in this Area
Purchase History
| Date | Buyer | Sale Price | Title Company |
|---|---|---|---|
| Li Yihong | $680,000 | Stewart Title Of California | |
| Ng Yu Chun | $463,000 | Chicago Title |
Source: Public Records
Mortgage History
| Date | Status | Borrower | Loan Amount |
|---|---|---|---|
| Open | Li Yihong | $250,000 | |
| Previous Owner | Ng Yu Chun | $285,000 | |
| Previous Owner | Ng Yu Chun | $291,000 | |
| Previous Owner | Ng Yu C | $218,300 | |
| Previous Owner | Ng Yu C | $200,000 | |
| Previous Owner | Ng Yu Chun | $333,700 | |
| Closed | Ng Yu Chun | $82,000 |
Source: Public Records
Tax History Compared to Growth
Tax History
| Year | Tax Paid | Tax Assessment Tax Assessment Total Assessment is a certain percentage of the fair market value that is determined by local assessors to be the total taxable value of land and additions on the property. | Land | Improvement |
|---|---|---|---|---|
| 2024 | $9,325 | $693,600 | $285,600 | $408,000 |
| 2023 | $9,325 | $632,301 | $299,683 | $332,618 |
| 2022 | $9,203 | $619,904 | $293,807 | $326,097 |
| 2021 | $9,174 | $607,750 | $288,047 | $319,703 |
| 2019 | $8,568 | $589,725 | $279,504 | $310,221 |
| 2018 | $7,906 | $551,000 | $261,150 | $289,850 |
| 2017 | $6,702 | $459,000 | $217,546 | $241,454 |
| 2016 | $5,622 | $372,000 | $176,312 | $195,688 |
| 2015 | $5,670 | $372,000 | $176,312 | $195,688 |
| 2014 | $4,667 | $293,000 | $138,869 | $154,131 |
Source: Public Records
Map
Nearby Homes
- 113 Carmel St Unit 35
- 121 San Pedro St
- 2571 El Portal Dr Unit D
- 2585 El Portal Dr Unit C
- 108 Padua St
- 2432 22nd St
- 13900 San Pablo Ave Unit 77
- 2425 Church Ln Unit 47
- 1245 21st St
- 2339 20th St
- 1964 Van Ness St
- 2802 Chattleton Ln
- 2808 Chattleton Ln
- 13700 San Pablo Ave Unit 2115
- 13700 San Pablo Ave Unit 2207
- 13700 San Pablo Ave Unit 2101
- 13700 San Pablo Ave Unit 1318
- 2036 21st St
- 1971 23rd St
- 2411 Dover Ave