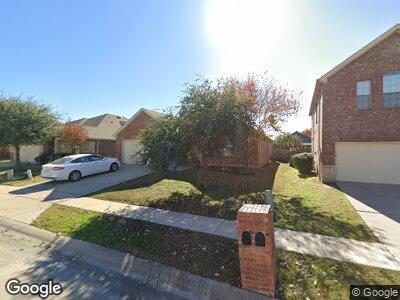
12416 Sunrise Dr Frisco, TX 75036
Hidden Cove & The Shores NeighborhoodEstimated Value: $389,000 - $415,000
4
Beds
2
Baths
1,810
Sq Ft
$223/Sq Ft
Est. Value
About This Home
This home is located at 12416 Sunrise Dr, Frisco, TX 75036 and is currently estimated at $404,414, approximately $223 per square foot. 12416 Sunrise Dr is a home located in Denton County with nearby schools including Hackberry Elementary School, Lowell H Strike Middle School, and Little Elm High School.
Ownership History
Date
Name
Owned For
Owner Type
Purchase Details
Closed on
Apr 30, 2014
Sold by
Rodgers Lauren E and Rodgers Russell A
Bought by
Chowdhurry Naheed
Current Estimated Value
Home Financials for this Owner
Home Financials are based on the most recent Mortgage that was taken out on this home.
Original Mortgage
$175,750
Interest Rate
4.46%
Mortgage Type
New Conventional
Purchase Details
Closed on
Jun 25, 2009
Sold by
Lennar Homes Of Texas Sales & Marketing
Bought by
Rodgers Lauren E and Rodgers Russell A
Home Financials for this Owner
Home Financials are based on the most recent Mortgage that was taken out on this home.
Original Mortgage
$174,811
Interest Rate
4.84%
Mortgage Type
Purchase Money Mortgage
Create a Home Valuation Report for This Property
The Home Valuation Report is an in-depth analysis detailing your home's value as well as a comparison with similar homes in the area
Home Values in the Area
Average Home Value in this Area
Purchase History
| Date | Buyer | Sale Price | Title Company |
|---|---|---|---|
| Chowdhurry Naheed | -- | None Available | |
| Rodgers Lauren E | -- | North American Title Company | |
| Lennar Homes Of Texas Sales & Marketing | -- | North American Title Company |
Source: Public Records
Mortgage History
| Date | Status | Borrower | Loan Amount |
|---|---|---|---|
| Open | Chowdhury Naheed | $204,000 | |
| Closed | Chowdhury Naheed | $176,827 | |
| Closed | Chowdhurry Naheed | $175,750 | |
| Previous Owner | Rodgers Lauren E | $174,811 |
Source: Public Records
Tax History Compared to Growth
Tax History
| Year | Tax Paid | Tax Assessment Tax Assessment Total Assessment is a certain percentage of the fair market value that is determined by local assessors to be the total taxable value of land and additions on the property. | Land | Improvement |
|---|---|---|---|---|
| 2024 | $5,685 | $374,000 | $124,380 | $249,620 |
| 2023 | $7,729 | $396,000 | $118,617 | $277,383 |
| 2022 | $5,757 | $310,863 | $99,168 | $267,794 |
| 2021 | $5,457 | $282,603 | $62,713 | $219,890 |
| 2020 | $5,406 | $269,500 | $62,713 | $209,772 |
| 2019 | $5,167 | $245,000 | $62,713 | $182,287 |
| 2018 | $4,822 | $245,000 | $62,713 | $182,287 |
| 2017 | $4,714 | $232,007 | $62,713 | $177,286 |
| 2016 | $5,467 | $210,915 | $62,713 | $154,086 |
| 2015 | $4,741 | $191,741 | $31,996 | $159,745 |
| 2014 | $4,741 | $169,120 | $31,996 | $142,731 |
| 2013 | -- | $153,745 | $31,996 | $125,575 |
Source: Public Records
Map
Nearby Homes
- 12417 Sunrise Dr
- 3198 Oyster Bay Dr
- 2858 Oyster Bay Dr
- 2915 Oyster Bay Dr
- 3197 Oyster Bay Dr
- 12628 Joplin Dr
- 4408 Coney Island Dr
- 12625 Joplin Dr
- 12613 Waterslide Way
- 4308 Coney Island Dr
- 2668 Oyster Bay Dr
- 2995 Rolling River Rd
- 5113 Sandra Dr
- 2517 Oyster Bay Dr
- 3194 Full Sail Ln
- 3066 Full Sail Ln
- 12228 Wind Surf Dr
- 2337 Brookdale Dr
- 7095 Deacon Dr
- 5009 Bluewater Dr