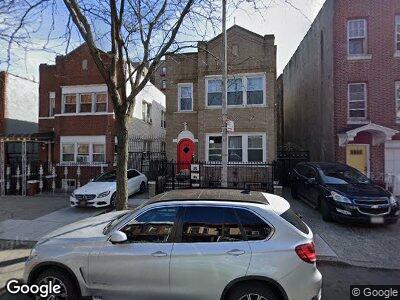
1246 College Ave Bronx, NY 10456
Concourse NeighborhoodEstimated Value: $970,000 - $1,255,000
--
Bed
--
Bath
2,646
Sq Ft
$434/Sq Ft
Est. Value
About This Home
This home is located at 1246 College Ave, Bronx, NY 10456 and is currently estimated at $1,148,943, approximately $434 per square foot. 1246 College Ave is a home located in Bronx County with nearby schools including P.S. 53 Basheer Quisim, P.S. 88 S Silverstein Little Sparrow School, and P.S. Is 218 Rafael Hernandez Dual Language Magnet School.
Ownership History
Date
Name
Owned For
Owner Type
Purchase Details
Closed on
Nov 13, 2024
Sold by
Swaby-Nugent Pansey A
Bought by
1246 Mazal Bh Llc
Current Estimated Value
Home Financials for this Owner
Home Financials are based on the most recent Mortgage that was taken out on this home.
Original Mortgage
$1,100,000
Outstanding Balance
$1,100,000
Interest Rate
6.32%
Mortgage Type
Purchase Money Mortgage
Estimated Equity
-$241,143
Purchase Details
Closed on
Jul 12, 2006
Sold by
Charlton Catherine C and Charlton Richard
Bought by
Swaby-Nugent Pansey A
Home Financials for this Owner
Home Financials are based on the most recent Mortgage that was taken out on this home.
Original Mortgage
$322,240
Interest Rate
6.67%
Mortgage Type
Purchase Money Mortgage
Purchase Details
Closed on
Apr 28, 1987
Sold by
Brisset Hannah and Brisset Exeof
Bought by
Charlton Catherine C and Charlton Richard
Create a Home Valuation Report for This Property
The Home Valuation Report is an in-depth analysis detailing your home's value as well as a comparison with similar homes in the area
Home Values in the Area
Average Home Value in this Area
Purchase History
| Date | Buyer | Sale Price | Title Company |
|---|---|---|---|
| 1246 Mazal Bh Llc | $1,175,000 | -- | |
| Swaby-Nugent Pansey A | $402,800 | -- | |
| Swaby-Nugent Pansey A | $402,800 | -- | |
| Charlton Catherine C | -- | -- | |
| Charlton Catherine C | -- | -- |
Source: Public Records
Mortgage History
| Date | Status | Borrower | Loan Amount |
|---|---|---|---|
| Open | 1246 Mazal Bh Llc | $1,100,000 | |
| Closed | 1246 Mazal Bh Llc | $940,000 | |
| Previous Owner | Swaby-Nugent Pansey A | $322,240 | |
| Previous Owner | Swaby-Nugent Pansey A | $80,560 |
Source: Public Records
Tax History Compared to Growth
Tax History
| Year | Tax Paid | Tax Assessment Tax Assessment Total Assessment is a certain percentage of the fair market value that is determined by local assessors to be the total taxable value of land and additions on the property. | Land | Improvement |
|---|---|---|---|---|
| 2024 | $3,518 | $17,518 | $3,690 | $13,828 |
| 2023 | $3,521 | $17,338 | $4,245 | $13,093 |
| 2022 | $3,269 | $39,120 | $11,400 | $27,720 |
| 2021 | $3,256 | $39,000 | $11,400 | $27,600 |
| 2020 | $3,090 | $33,720 | $11,400 | $22,320 |
| 2019 | $3,054 | $33,000 | $11,400 | $21,600 |
| 2018 | $2,945 | $14,448 | $5,055 | $9,393 |
| 2017 | $2,781 | $13,644 | $6,751 | $6,893 |
| 2016 | $2,577 | $12,892 | $5,419 | $7,473 |
| 2015 | $1,552 | $12,165 | $4,290 | $7,875 |
| 2014 | $1,552 | $12,165 | $4,576 | $7,589 |
Source: Public Records
Map
Nearby Homes
- 1241 College Ave
- 1207 Findlay Ave
- 364 E 169th St
- 1302 Findlay Ave
- 1275 Grant Ave Unit 5E
- 1259 Grant Ave Unit 8A
- 1259 Grant Ave Unit 7B
- 1259 Grant Ave Unit 10E
- 1325 College Ave
- 1305 Clay Ave
- 1180 Grant Ave
- 1313B Clay Ave
- 1171 Grant Ave
- 1180 Sherman Ave
- 1335 Clay Ave
- 1350 Clay Ave
- 1367 Clay Ave
- 1387 Clay Ave
- 1070 Morris Ave
- 1069 Grant Ave