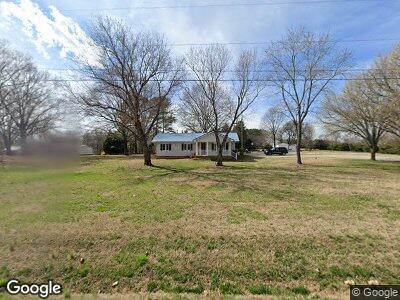
1250 Hurley School Rd Salisbury, NC 28147
Estimated Value: $176,000 - $226,000
3
Beds
2
Baths
1,282
Sq Ft
$151/Sq Ft
Est. Value
About This Home
This home is located at 1250 Hurley School Rd, Salisbury, NC 28147 and is currently estimated at $193,333, approximately $150 per square foot. 1250 Hurley School Rd is a home located in Rowan County with nearby schools including Hurley Elementary School, West Rowan Middle School, and West Rowan High School.
Ownership History
Date
Name
Owned For
Owner Type
Purchase Details
Closed on
May 9, 2019
Sold by
Stillwell Christopher Shane and Stillwell Rebecca Wilhelm
Bought by
Stillwell Rebecca Wilhelm
Current Estimated Value
Purchase Details
Closed on
Nov 7, 2013
Sold by
Stillwell Jonathan Scott and Stillwell Karen Findley
Bought by
Stillwell Christopher Shane and Stillwell Rebecca Wilhelm
Purchase Details
Closed on
Mar 9, 2007
Sold by
Jones Loretta J
Bought by
Stillwell Michael Theodore
Home Financials for this Owner
Home Financials are based on the most recent Mortgage that was taken out on this home.
Original Mortgage
$121,928
Interest Rate
6.11%
Mortgage Type
Unknown
Create a Home Valuation Report for This Property
The Home Valuation Report is an in-depth analysis detailing your home's value as well as a comparison with similar homes in the area
Home Values in the Area
Average Home Value in this Area
Purchase History
| Date | Buyer | Sale Price | Title Company |
|---|---|---|---|
| Stillwell Rebecca Wilhelm | -- | None Available | |
| Stillwell Christopher Shane | $30,000 | None Available | |
| Stillwell Michael Theodore | $148,000 | None Available |
Source: Public Records
Mortgage History
| Date | Status | Borrower | Loan Amount |
|---|---|---|---|
| Open | Stillwell Christopher Shane | $107,565 | |
| Previous Owner | Stillwell Michael T | $121,928 | |
| Previous Owner | Stillwell Michael T | $14,600 | |
| Previous Owner | Stillwell Michael Theodore | $135,426 | |
| Previous Owner | Jones Robert H | $20,700 | |
| Previous Owner | Jones Robert H | $95,200 |
Source: Public Records
Tax History Compared to Growth
Tax History
| Year | Tax Paid | Tax Assessment Tax Assessment Total Assessment is a certain percentage of the fair market value that is determined by local assessors to be the total taxable value of land and additions on the property. | Land | Improvement |
|---|---|---|---|---|
| 2024 | $1,147 | $169,266 | $41,830 | $127,436 |
| 2023 | $1,147 | $169,266 | $41,830 | $127,436 |
| 2022 | $893 | $118,274 | $32,220 | $86,054 |
| 2021 | $884 | $118,274 | $32,220 | $86,054 |
| 2020 | $884 | $118,274 | $32,220 | $86,054 |
| 2019 | $884 | $118,274 | $32,220 | $86,054 |
| 2018 | $717 | $96,723 | $32,220 | $64,503 |
| 2017 | $717 | $96,723 | $32,220 | $64,503 |
| 2016 | $692 | $93,369 | $32,220 | $61,149 |
| 2015 | $582 | $77,631 | $31,524 | $46,107 |
| 2014 | $806 | $104,011 | $31,524 | $72,487 |
Source: Public Records
Map
Nearby Homes
- 1030 Hurley School Rd
- 133 Falling Up Ln
- 121 Falling Up Ln
- 139 Falling Up Ln
- 140 Smoke Ln Unit 1
- 4620 Sherrills Ford Rd
- 325 Hurley School Rd
- 4120 Statesville Blvd
- Statesville Blvd and Athens Blvd
- Statesville Blvd and Athens Blvd
- 205 Athens Dr Unit 31
- 3770 Statesville Blvd
- 144 Cameron Dr
- 1117 Shadowmoss Ct
- 1234 Oakbluff Dr
- 2831 Enon Church Rd
- 175 Neita Dr
- 0 Redman Dr Unit 18 CAR4182349
- 0 Catawba Dr
- 1450 Majolica Rd